Elearnmarkets - Financial Market Learning
  • Courses
  • Webinars
  • Stories
  • Language
    • English
    • Hindi
    • Bengali
No Result
View All Result
Get Free Course
  • Basic Finance
  • Derivatives
    • Futures
    • Options
  • Financial Planning
  • Fundamental Analysis
  • Technical Analysis
  • Mutual Funds
  • Marketshala
  • Miscellaneous
Elearnmarkets - Learn Stock Market, trading, investing for Free
  • Courses
  • Webinars
  • Stories
  • Language
    • English
    • Hindi
    • Bengali
No Result
View All Result
Get Free Course
Elearnmarkets - Learn Stock Market, trading, investing for Free
No Result
View All Result
Home Basic Finance
A Detailed Understanding on Index of Industrial Production (IIP) 1

A Detailed Understanding on Index of Industrial Production (IIP)

Elearnmarkets by Elearnmarkets
November 21, 2024
in Basic Finance, Macroeconomics
Reading Time: 10 mins read
0
5k
VIEWS
Share on FacebookShare on XShare on WhatsApp

We all know that Gross Domestic Product (GDP) is a measure of the complete activity in the Indian economy. Yet is there some indicator that explicitly reflects the industrial activities in the Indian economy? The answer is Yes and this is known as Index of Industrial Production (IIP).

Table of Contents
What is Index of Industrial Production (IIP)
Classification of Index of Industrial Production
Weightage of the different sectors in IIP
Who publishes IIP data?
Sources of Data Collection
Calculation of IIP
Impact of IIP on the economy
Example of the impact of IIP data on stock prices
Bottomline

What is Index of Industrial Production (IIP)?

The Index of Industrial Production(IIP) is a combined indicator.

It is expressed in the form of an index number. This measures the short-term variations in the production volume of a basket of industrial goods during a particular time period with reference to a base time period.

Thus, IIP is a short-term measure of industrial growth till the outcomes from Annual Survey of Industries (ASI) and National Accounts Statistics such as GDP are available.

Base Year Value in IIP:

  • The base year for IIP is always given a value of 100.
  • The base year of IIP has been revised to 2011-2012 (in the month of May)
  • This has been done in order to bring the IIP data at par with GDP data(GDP base year has been revised to 2011-2012).

For Example: 

Suppose the value of IIP in 2016 was 140.

This means that there has been a 40%(140-100) increase in the industrial activities in India as compared to the industrial activities in 2011-2012.

Classification of Index of Industrial Production (IIP):

Sector-wise classification of IIP:

As per United Nations Statistics Division: the scope of IIP should include

1. Mining
2. Manufacturing
3. Electricity
4. Gas Steam
5. Air Conditioning Supply
6. Water Supply
7. Waste Management, Sewerage, and Remediation Activities

But due to data availability constraints for items (4) to (7), they are not included in the Indian IIP. Thus sector-wise Indian IIP comprises the following three broad sectors:

1. Mining
2. Manufacturing
3. Electricity

Use-Based classification of Index of Industrial Production (IIP)

The use-based classification of IIP comprises of the following categories of representative goods:

1. Primary Goods:
2. Capital Goods
3. Intermediate Goods
4. Infrastructure/Construction Goods
5. Consumer Durables
6. Non-Consumer Durables

Item-wise classification of IIP:

IIP with the base year 2011-2012 comprises of 839 items and 407 items groups.
Of the 407 item groups: 405 item groups pertain to the manufacturing sector.
While mining and electricity, sector comprise of a single item group each.

  •  Manufacturing Sector comprises of 809 items
  •  Mining Sector comprises of 29 items
  •  Electricity Sector comprises of 1 item.

IIP Weightage of the different sectors:

Mining sector items comprise of 14.37% of the weight of all the items included in IIP.
While the manufacturing sector comprises of 77.6% by weight of all the items of IIP.
Finally, the electricity sector comprises of 7.9% by weight of all the items of IIP.

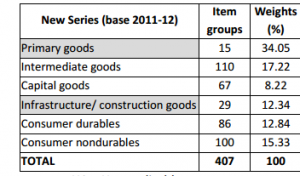
Weightage as per Use-based classification in IIP:

A Detailed Understanding on Index of Industrial Production (IIP) 2

Who publishes IIP data?

IIP is compiled and published on a monthly basis by Central Statistics Office (CSO) of the Ministry of Statistics and Programme Implementation.
It is published with a lag period of 6 weeks from the end of the Reference Month.
Reference Month can be defined as the month for which the IIP data is being released.

IIP data release comprises of quick estimates of the IIP for the relevant month as well as revised and final indices.

The revised indices are the first revision of the quick estimates of the month prior to the reference month.

While the final indices are the final revised quick estimates of two months prior to the reference month.

Sources of Data Collection:

The data required for the compilation of IIP is sourced from 14 agencies:
1. Indian Bureau of Mines
2. Directorate of Sugar and Vegetable Oils
3. Tea Board
4. Coffee Board
5. Office of the Textile Commissioner
6. Office of the Jute Commissioner
7. Office of the Coal Controller
8. Ministry of Petroleum and Natural Gas
9. Joint Plant Committee(Iron and Steel)
10. Railway Board
11. Department of Industrial Policy and Promotion(DIPP)
12. Department of Chemicals and Petrochemicals
13. Department of Fertilizers
14. Central Electricity Authority

Calculation of IIP:

  • The compilation of IIP is carried out in multiple stages.
    Initially for the items.
    Then for the sub-groups groups and major groups.
    Finally for all the sectors combined.
  • The items included in IIP are selected from the results of 3-digit level National Industrial Classification(NIC)-2008.
  • The selection is done in such a way so as to ensure that all the selected items contribute to at least 80% of the output of each 3 digit group.
  • Each item is given a relevant weight.
  • Weights at the sectoral levels are computed by using the sectoral Gross Value Added(GVA) , the GVA figures are obtained from National Accounts Statistics with the base year 2011-2012.

IIP is calculated as a simple weighted arithmetic mean of production relatives by using Laspreye’s Formula:

IIP=Summation(Wi.Ri)/Summation(Wi)
Where : Ri= Production Relative of the i th item for the relevant month
Wi= Weight allotted to the ith item

Production Relative is calculated as:
Ri= Qi/Qo
Where: Qi= Quantity produced in the current year in the reference month
Qo= Quantity produced in the base year in the reference month

Impact of IIP on the economy:

A low IIP implies a lower production in the industrial sector.
This, in turn, can be detrimental to the growth of the economy and vice-versa.

Also Read: A quick introduction to the term index and its concepts

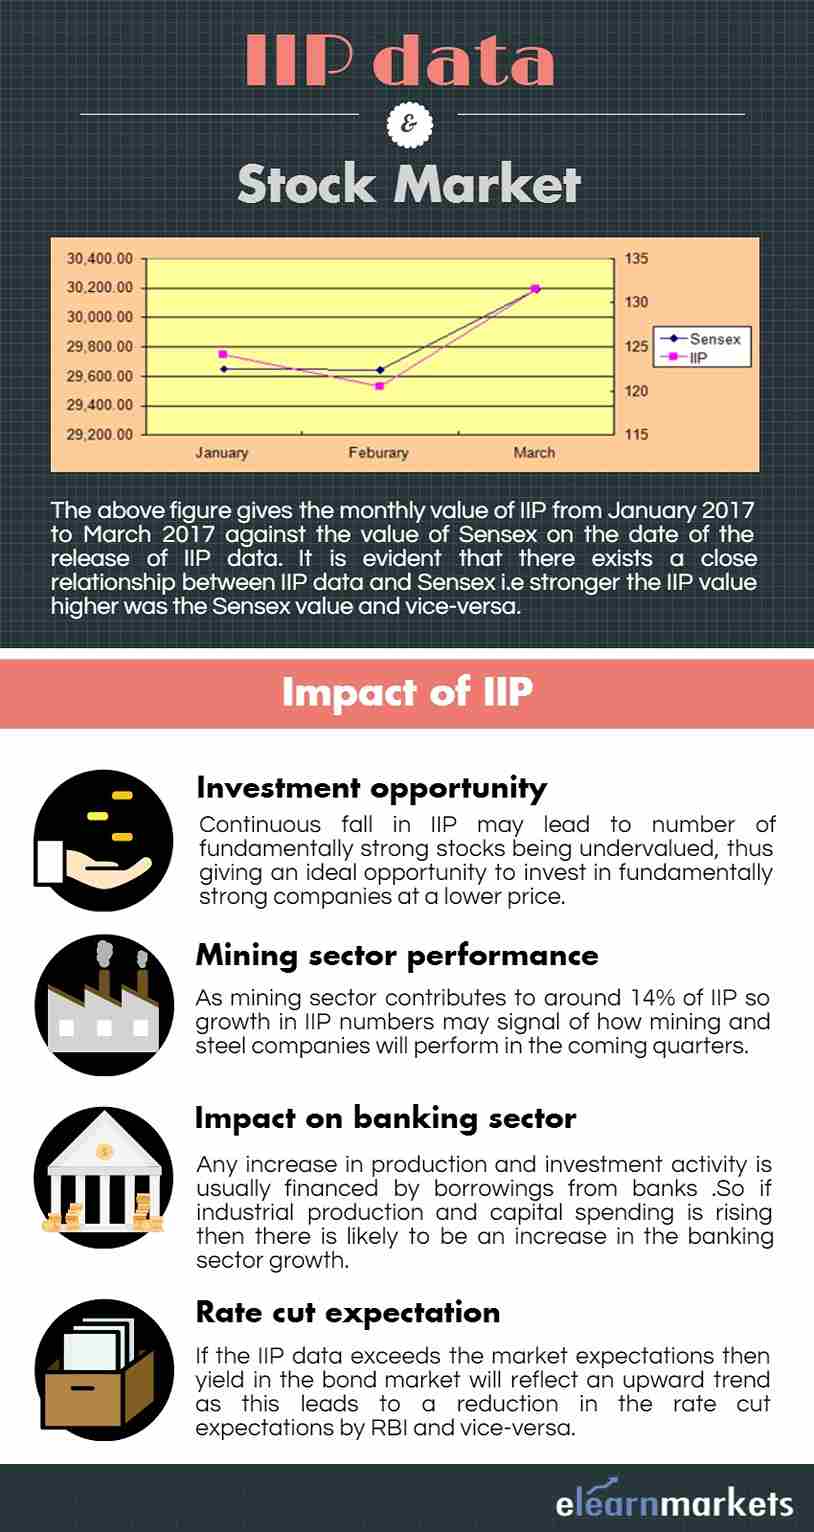
IIP Data and Stock Market:

  • Decreased Consumer Spending will lead to lower demand.
    The producers will respond to this low demand situation by reducing their production.
    A low industrial production will result in lower corporate sales and profits.
    Thus a direct impact of weak IIP data is a sudden fall in stock prices.
  • On the other hand, a strong IIP data will imply higher industrial production.
    This, in turn, will imply higher demand, which in turn will lead to higher corporate sales and to greater profits.
    Hence a direct impact of a strong IIP data will be a rise in the stock prices.
  • A continuous fall in IIP may lead to many strong stocks being undervalued.
    This gives an individual an ideal opportunity to invest in strong companies at a lower price.
  • As mining sector contributes to around 14% of IIP so growth in IIP numbers can give a signal of how mining and steel companies will perform in the coming quarters.
  • Any increase in production and investment activity is usually financed by borrowings from banks.
    So if industrial production and capital spending are rising it then there is likely to be an increase in the banking sector growth.
  • Similarly a weak IIP data can have an adverse impact on the banking sector.
  •  If the IIP data exceeds the market expectations then yield in the bond market will reflect an upward trend as this leads to a reduction in the rate cut expectations by RBI and vise-versa.

    IIP and Sensex:

    A Detailed Understanding on Index of Industrial Production (IIP) 3

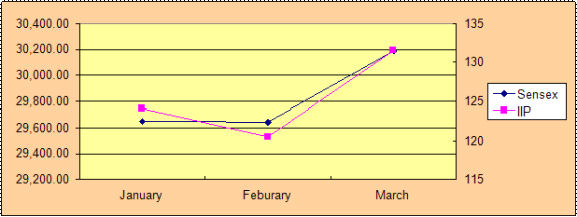
  •  Source: http://www.bseindia.com/ and http://mospi.nic.in/

    The above figure gives the monthly value of IIP for the three month period starting from January 2017 to March 2017 against the value of Sensex on the date of the release of IIP data(usually the 12 th of the month).

    As it is clear from the above figure there exists a close relationship between IIP data and Sensex i.e stronger the IIP value higher was the Sensex value and vice-versa.

A Detailed Understanding on Index of Industrial Production (IIP) 4

Example of the impact of IIP data on stock prices:

The February 2017 IIP of 120.5 (released on 12th April) registered a fall of 2.9 as compared to the previous month IIP.

The overall weak IIP data lead to a fall in the stock prices as shown in the tables below.

For representative purposes: three companies have been selected from three broad sectors viz Manufacturing sector, Mining sector and Electricity Sector, which comprises the IIP.

A Detailed Understanding on Index of Industrial Production (IIP) 5
A Detailed Understanding on Index of Industrial Production (IIP) 6
A Detailed Understanding on Index of Industrial Production (IIP) 7

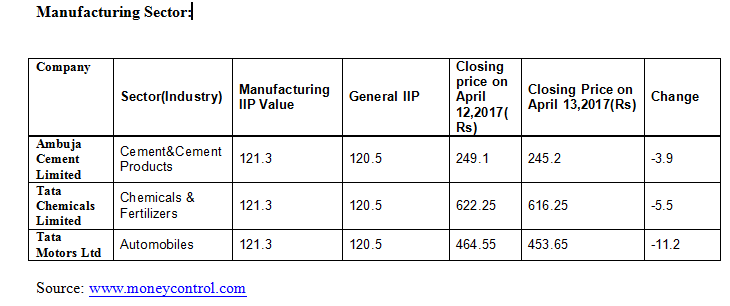
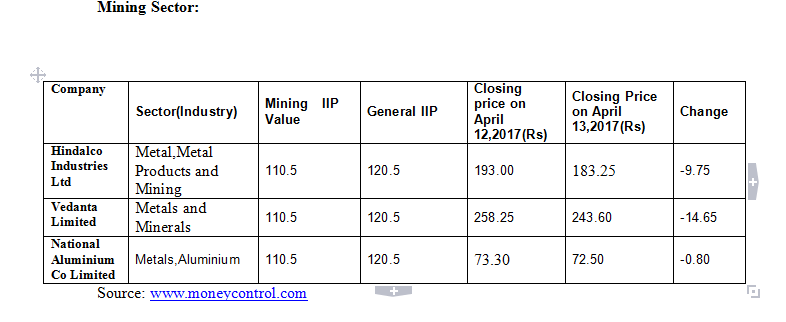
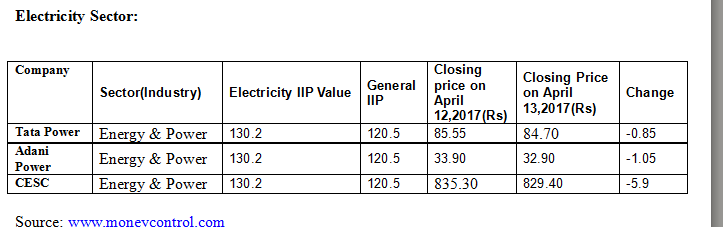
Thus it can be seen from the tables above that weak IIP data leads to a fall in the stock prices.

Bottomline:

Index of Industrial Production (IIP), in essence, gives a measure of the performance of the industries. However, some sectors may outperform other sectors on account of a variety of reasons, such as growth prospects, position in the business cycle, government policy, international factors, etc.

For example, The passage of GST Bill is likely to have a positive impact on the consumer durables sector which is likely to perform better as compared to other.

But, as IIP does not reflect the reason behind the better/worse performance of a sector, therefore, it should not form the sole basis for investments in the stock markets.

It is essential to know the reason for the better/worse performance of a sector before investing.

Feel free to write back to us in the comment box below.


Tags: englishGDPiipIndex of Industrial Productionmacroeconomics
ShareTweetSend
Get Kotak Offer Get Kotak Offer Get Kotak Offer
Previous Post

8 आसान तरीको से करे खुद की फाइनेंसियल प्लानिंग

Next Post

“कंपाउंडिंग की शक्ति” कैसे काम करती है?

Elearnmarkets

Elearnmarkets

Elearnmarkets (ELM) is a complete financial market portal where the market experts have taken the onus to spread financial education. ELM constantly experiments with new education methodologies and technologies to make financial education effective, affordable and accessible to all. You can connect with us on Twitter @elearnmarkets.

Related Posts

Concept of Fund of Funds
ETFs & Mutual Funds

Easy Guide to Understanding the Concept of Fund of Funds

June 3, 2025
150
How is standard deviation used in mutual fund
ETFs & Mutual Funds

How is Standard Deviation Used in Mutual Fund

April 22, 2025
528
Ways to Make Trading More Transparent
Cryptocurrency

Under the Crypto Hood: 5 Ways to Make Trading More Transparent

May 5, 2025
93
options trading books
Basic Finance

Top 5 Options Trading Books for Beginners

May 27, 2025
1.2k

Leave a Reply Cancel reply

Your email address will not be published. Required fields are marked *

Disclaimer

Elearnmarkets (Kredent InfoEdge Pvt. Ltd.) is a SEBI-registered Research Analyst (RA) entity (SEBI Registration No.: INH300007493). The information provided in this article is for educational and informational purposes only and should not be considered as an offer to buy or sell any securities or investment products.

The stocks, securities, and investment instruments mentioned herein are not recommendations under SEBI (Research Analysts) Regulations, 2014. Readers are advised to conduct their own due diligence and seek independent financial advice before making any investment decisions.

Investments in securities markets are subject to market risks. Please read all related documents carefully before investing. Investing in Equity Shares,
Derivatives, Mutual Funds, or other instruments carry inherent risks, including potential loss of capital. Elearnmarkets (Kredent InfoEdge Pvt. Ltd.) does not provide any guarantee or assurance of returns on any investments. Past performance is not indicative of future performance.

Elearnmarkets Logo

Follow Us

Facebook-f X-twitter Instagram Linkedin-in Youtube Telegram

Register on Elearnmarkets

Continue your financial learning by creating your own account on Elearnmarkets.com

Register Free Account

Download App

Playstore logo
Download on app store

Categories

  • Basic Finance
  • Derivatives
  • Financial Planning
  • Fundamental Analysis
  • Technical Analysis
  • Mutual Funds
  • Miscellaneous

Popular On Elearnmarkets

  • Market Superheroes:
  • Vivek Bajaj
  • Chetan Panchamia
  • Ashish Kyal
  • Premal Parekh
  • Abhijit Paul
  • Jegan
  • Sivakumar Jayachadran
  • Jyoti Budhia
  • Vivek Gadodia
  • Vishal Mehta
  • Piyush Chaudhry
  • Santosh Pasi
  • Gomathi Shankar
  • Market Superheroes:
  • Vivek Bajaj
  • Chetan Panchamia
  • Ashish Kyal
  • Premal Parekh
  • Abhijit Paul
  • Jegan
  • Sivakumar Jayachadran
  • Jyoti Budhia
  • Vivek Gadodia
  • Vishal Mehta
  • Piyush Chaudhry
  • Santosh Pasi
  • Gomathi Shankar
  • Courses:​
  • Options Trading
  • Dow Theory
  • Momentum Trading
  • Stock Investing
  • Harmonic Chart Patterns
  • Algo Trading
  • Elliot Wave Theory
  • Advanced Excel
  • Cryptocurrency
  • NSE Certification Course
  • Courses:​
  • Options Trading
  • Dow Theory
  • Momentum Trading
  • Stock Investing
  • Harmonic Chart Patterns
  • Algo Trading
  • Elliot Wave Theory
  • Advanced Excel
  • Cryptocurrency
  • NSE Certification Course
  • Webinars:
  • Bank Nifty Scalping
  • Intraday Trading Strategies
  • Options Trading Strategies
  • Options selling
  • Price Action
  • Relative Strength
  • Tax Planning
  • Options Buying
  • Growth Stocks
  • Portfolio Management
  • Risk Management
  • Renko Charts
  • Crude Oil
  • Traders Psychology
  • Moving Average
  • Multibagger Stocks
  • Free Learning Modules:
  • Intraday Trading
  • Options Scalping
  • Swing Trading
  • Financial Modelling
  • RSI Indicator
  • Bollinger Bands
  • Pricing of Futures
  • Personal Finance
  • Initial Public Offerings (IPO)
  • Value Investing
  • Technical Indicators
  • Candlesticks
  • Chart Patterns
  • Option Greeks
  • ELSS Funds
  • Banking and Insurance
  • Real Estate
  • Gold
  • Book Summaries:
  • Rich Dad Poor Dad
  • Psychology of Money
  • The Intelligent Investor
  • The Richest Man in Babylon
  • Think and Trade Like a Champion
  • Value Investing and Behavioural Finance
  • Trading in the Zone
  • Learn to Earn
  • Book Summaries:
  • Rich Dad Poor Dad
  • Psychology of Money
  • The Intelligent Investor
  • The Richest Man in Babylon
  • Think and Trade Like a Champion
  • Value Investing and Behavioural Finance
  • Trading in the Zone
  • Learn to Earn
  • Tools:
  • CAGR Calculator
  • SIP Calculator
  • eLearnOptions
  • Future Value Calculator
  • Present Value Calculator
  • Atal Pension Yojana
  • Cost of Delay Calculator
  • Become a Crorepati
  • Tools:
  • CAGR Calculator
  • SIP Calculator
  • eLearnOptions
  • Future Value Calculator
  • Present Value Calculator
  • Atal Pension Yojana
  • Cost of Delay Calculator
  • Become a Crorepati

© 2025 Elearnmarkets. All Rights Reserved

  • Visit Elearnmarkets
  • Courses
  • Webinars
  • Financial Guides
  • Get Free Counselling
  • Visit Elearnmarkets
  • Courses
  • Webinars
  • Financial Guides
  • Get Free Counselling

Download Our App

No Result
View All Result
  • Article Categories
    • Basic Finance
    • Derivatives
    • Financial Planning
    • Fundamental Analysis
    • Technical Analysis
    • ETFs & Mutual Funds
    • Marketshala
    • Miscellaneous
  • Language
    • Hindi
    • Bengali
    • English
  • Courses
  • Webinars
  • Stories
Get Free Course

© 2024 Elearnmarkets All Rights Reserved

Guide to Basics of Stock Investing
Learn to interpret the financial performance and health of a company.
Download Guide For FREE
How to Spot False Dips and Trade with Confidence