
Open interest, also known as OI, is the total number of options or futures contracts of a particular security or index that are not closed or delivered on a particular business day.
Table of Contents
How is open interest Calculated?
Let’s try to understand open interest by an example. Let’s say we have a trader A who buys 1 future contract of Reliance Industries from trader B (who is the seller here), then open interest of that security (Reliance) is 1.
Now another trader C wants to buy 2 futures contracts of the same security (Reliance in this case) from trader D (seller), then the open interest rises by 2 and becomes 3. Now, if trader A wants to sell (unwind) his/her position and the counter party is either B or D, then the open interest of the security will reduce by that quantity (one in this case). However, in case trader A unwinds his position and the counterparty (sell Reliance futures) is a new entrant, say E, then the open interest will remain unchanged. This is because while trader A has squared off his position, E’s position is still open. (This is because only the trader’s hands are exchanged; no new contract is sold or written).
Below is a simple table to understand the calculation of open-interest,
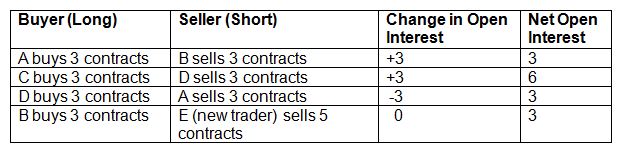
In conclusion, we can say that if a new buyer (trader A) buys 1 contract and a new seller (trader B) sells 1 contract, then the open interest will increase by one contract. If one old buyer (trader A) and one old seller (trader D) are closing an existing position, open interest will decline by 1. However, if an old buyer sells his contract to a new buyer, then the open interest will not change.
How to interpret open interest and its relation with price movement?
Tracking open interest alone does not signify much information; however, its relation with price movement will give a lot of information regarding the current trend in the particular contract to the trader and investors.
Below is the chart showing the relation between Open Interest (OI) and contract price.
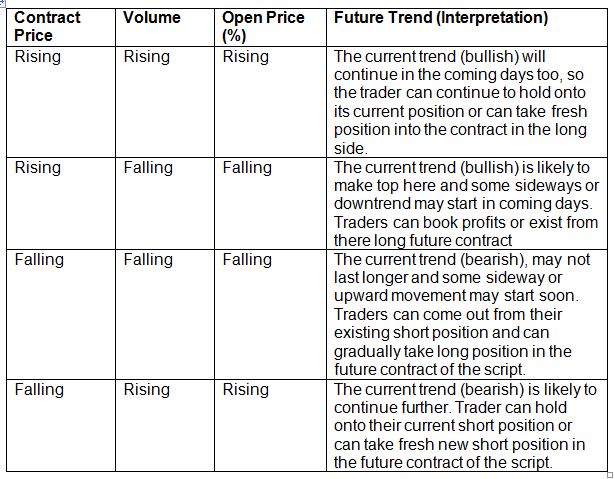
From the above chart, we can conclude,
- Open Interest Rising indicates that the present trend (uptrend, downtrend, or flat) is likely to continue.
- Open Interest Falling indicates that the present trend (uptrend, downtrend, or flat) is likely to change or end.
Unlike volumes, the change in open interest does not really give any directional view of markets. However, it does give a sense of strength between a bullish or bearish trend. Generally, if there is a sudden high open interest backed by a rapid increase or decrease in the prices of the stock or index, then it’s time to be cautious. This situation simply indicates that there is a lot of buzz and leverage being built up in the market. So any sudden good or bad news could trigger a big upswing or downswing in the stock or index.
The Open Interest position calculated every day is either positive or negative versus the previous business day. For example, below is the Reliance future OI for the July contract.
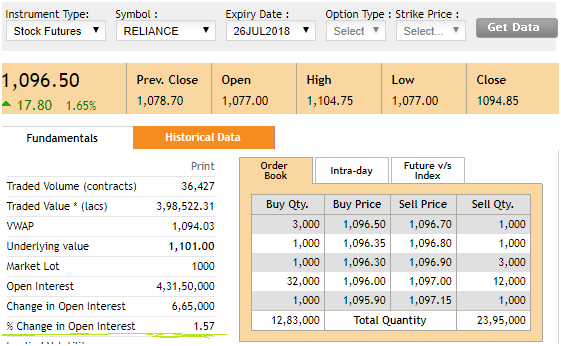
From above, we can see that the OI is 1.57% more than the previous day’s OI. More position would mean more cash inflows into the market, while a decline in position would simply mean liquidity and that the current price movement has reached its top or bottom and time for a possible reversal in trend.

Traders, who trade in derivatives, track price movements in terms of premium and discount of contracts in relation to cash markets. All these analyses are based on the relationship between futures contracts and their corresponding spot prices also known as cost-of-carry. It primarily indicates the sentiment of the participants on the basis of the premium or discount.
Bottomline
Open Interest (OI) is a number that tells you how many contracts of the particular script are currently outstanding (open) in the market. Open interest increases when new contracts are added and it decreases when contracts are squared off. Open interest will not change where there is merely a change of hands from one party to another. Unlike volumes, open interest is continuous data.
Frequently Asked Questions (FAQs)
What is open interest?
The total number of open contracts for a specific financial instrument, like futures or options, that have not yet been closed or exercised is referred to as open interest.
How is open interest useful?
Open interest gives information about the volume of trade or liquidity in a specific market. It can assist traders in determining the mood of the market and probable price moves.
How does open interest relate to price movements?
Variations in open interest may be a sign of mood changes in the market. A notable rise in open interest in conjunction with rising prices, for instance, indicates a positive feeling, whereas a decline in open interest could indicate dwindling interest or a trend reversal.


