Elearnmarkets - Financial Market Learning
  • Categories
    • Basic Finance
    • Derivatives
      • Futures
      • Options
    • Financial Planning
    • Fundamental Analysis
    • Technical Analysis
    • Marketshala
    • Miscellaneous
  • Language
    • English
    • Hindi
    • Bengali
No Result
View All Result
  • Courses
  • Webinars
  • Stories
Elearnmarkets - Learn Stock Market, trading, investing for Free
No Result
View All Result
Home Fundamental Analysis
CANSLIM

CANSLIM- the winning Techno-Fundamental strategy

Elearnmarkets by Elearnmarkets
August 16, 2023
in Fundamental Analysis, Technical Analysis, Trading Terms, Rules & Strategies
Reading Time: 5 mins read
0
3.1k
VIEWS
Share on FacebookShare on XShare on WhatsApp

Listen to this:

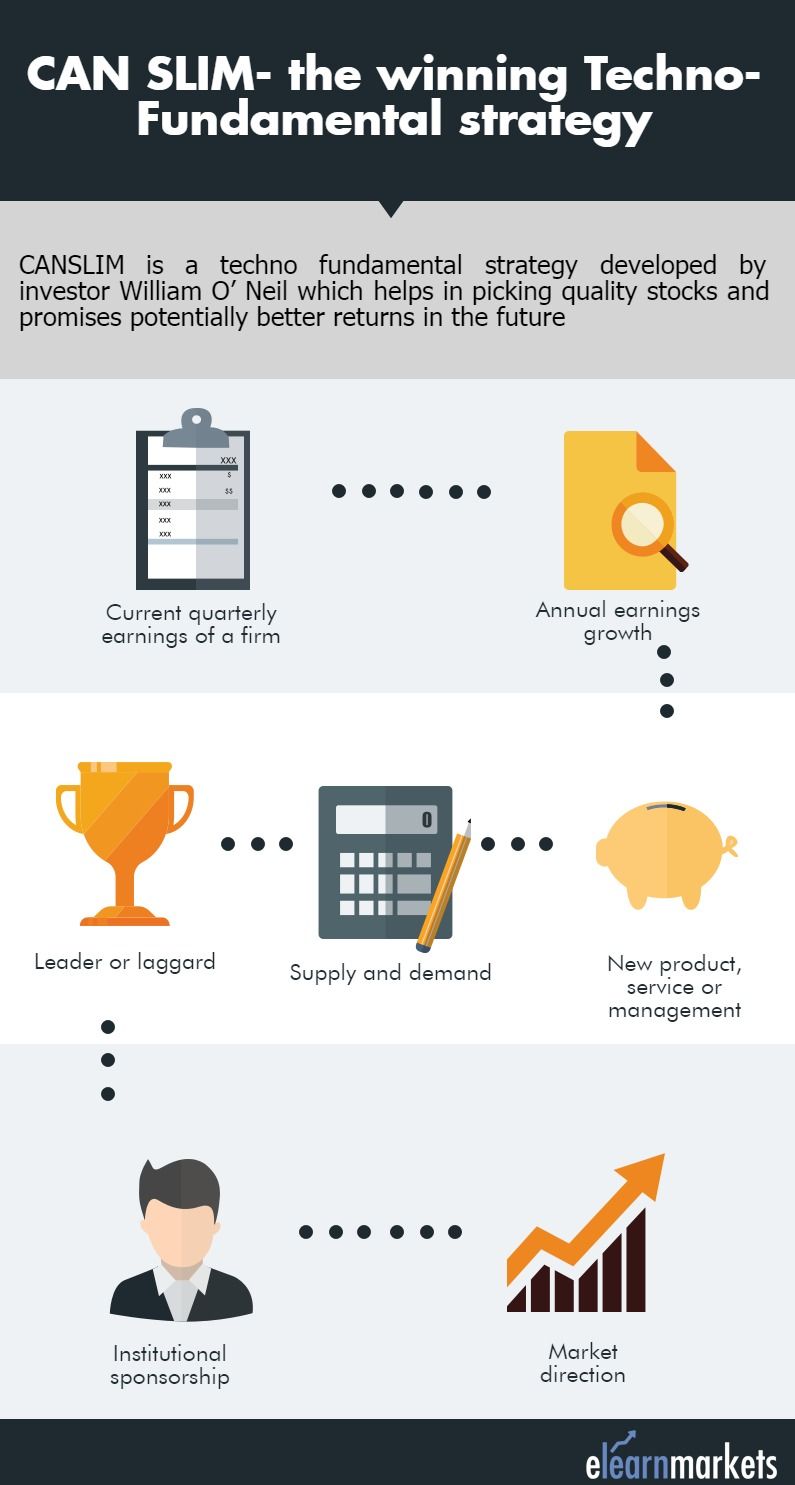
CANSLIM is a techno- fundamental strategy developed by investor William O’ Neil which helps in picking quality stocks and promises potentially better returns in the future  This strategy is ideal for investors who cannot hold the stocks for longer periods say more than 5-6 years.

Today when the market is close to its lifetime high, stock picking has really become even more difficult. Even investors are in a dilemma that whether they should go by company’s fundamental or should time the market based on technical parameters. However, the combination of technicals and fundamentals can be a winning strategy since technicals provide attractive entry and exit points while fundamental provide conviction to hold the stock.

CANSLIM strategy- Current quarterly earning of a firm, Annual earnings growth,   New product or service, Supply and demand, Leader or laggard, Institutional sponsorship and Market direction

How does CANSLIM methodology work?

So if you are confused as to how to simultaneously use both the approaches, you can simply go with the CANSLIM methodology-

1. Current Quarterly Earnings of a Firm

One should look at the earnings growth over the last three quarters and CANSLIM also acknowledge the importance of selecting stocks whose EPS in the recent quarter have grown on a yearly basis.A  growth of at least 25% is a good starting point.

For instance, a company’s EPS in the July September quarter should have grown as compared to the EPS figure for that same three month period a year ago.

RelatedPosts

How to Identify Thief Companies in the Stock Market? 1

How to Identify Thief Companies in the Stock Market?

September 29, 2023
34
5 Tools to Spot Trend Reversals in Stocks 2

5 Tools to Spot Trend Reversals in Stocks

September 28, 2023
6k
Beginner's Guide to Trading Penny Stocks 3

Beginner’s Guide to Trading Penny Stocks

September 26, 2023
570

2. Annual Earnings Growth

William O’ Neil also emphasizes the importance of growth in annual earnings. The system indicates that the company should target for annual earnings and sales growth of at least 25% for the past three years and a return on equity of more than 17%. You may do NSE Academy Certified Equity Research Analysis to learn about equity research from the very scratch.

3. New Product, Service or Management

The third criteria as per CANSLIM mechanism is that it should undergo changes from time to time, which is a very important element for any company to become successful. The biggest winner companies in the past have one common element which includes changes in terms of new products, new leadership, new services, new pricing or a new condition in the industry. William O’ Neil discovered that 95% of the companies he analyzed had experienced something new.

4. Supply and demand

The S in CAN SLIM stands for Supply and Demand. The analysis of supply and demand study is one of the very important parameters in this analysis. You should look for stocks which see heavy accumulation by the institutional investors especially at levels where the stock is breaking the prior resistance levels.  You may download Stockedge app to track institutional data i.e. where the big money is flowing.

You can check out the below video to understand better how to track institutional data by using the Stockedge app:

5. Leader or Laggard

Knowing the market leaders and market laggards will be of key importance as per CANSLIM analysis. Every industry has leaders which provide good gains to their shareholders as well as laggards which disappoint in most situations. The idea here is to distinguish the leaders from the laggards. In short, one should buy leading stocks from the leading industry groups.

6. Institutional Sponsorship

A stock in order to be a top performer must have an institutional support to boost its price movement. CANSLIM requires  companies to have some institutional sponsorship. However, this sponsorship should be limited say, 3-7 institutional owners. It is of great concern if the stock is over-owned by the institutional investors as any bad news may lead to heavy selling.

Institutional sponsor
Source: www.stockaxis.com

7. Market direction

The final criteria of CANSLIM is the market direction. It’s important to trade in sync with the market as 70-80 percent of the stocks move in tandem with the direction of the market. You should know whether you are into bull or bear market, otherwise, you may end up investing against the trend and may end up losing or compromising on your gains.

To understand the concept of CANSLIM in a more better manner; you can watch the video below :

You may do NSE Academy Certified Technical Analysis course to enhance your understanding to analyze charts and other technical parameters to enhance your trading experience.

Bottomline

CANSLIM is a simple yet very effective analyzing tool which combines value, growth, fundamental, and even technical analysis and provides solid guidelines thus keeping subjectivity to a minimum. Thus it includes important parameters from all major investment strategies.

Tags: englishtechno fundamental strategy
ShareTweetSend
Get Kotak Offer Get Kotak Offer Get Kotak Offer
Previous Post

Nifty Consolidates Below 200 Hourly Moving Average

Next Post

Nifty And Bank Nifty At Crucial Juncture, Both End Above Respective “Make Or Break” 50 DMA

Elearnmarkets

Elearnmarkets

Elearnmarkets (ELM) is a complete financial market portal where the market experts have taken the onus to spread financial education. ELM constantly experiments with new education methodologies and technologies to make financial education effective, affordable and accessible to all. You can connect with us on Twitter @elearnmarkets.

Related Posts

How to Identify Thief Companies in the Stock Market? 4
Fundamental Analysis

How to Identify Thief Companies in the Stock Market?

September 29, 2023
34
5 Tools to Spot Trend Reversals in Stocks 5
Technical Analysis

5 Tools to Spot Trend Reversals in Stocks

September 28, 2023
6k
Beginner's Guide to Trading Penny Stocks 6
Technical Analysis

Beginner’s Guide to Trading Penny Stocks

September 26, 2023
570
5 Important Volatility Indicators that Traders should know 7
Technical Analysis

5 Important Volatility Indicators that Traders should know

September 19, 2023
58.3k

Leave a Reply Cancel reply

Your email address will not be published. Required fields are marked *

Elearnmarkets Logo

Follow Us

Facebook-f Twitter Instagram Linkedin-in Youtube Telegram

Register on Elearnmarkets

Continue your financial learning by creating your own account on Elearnmarkets.com

Register Free Account

Download App

Playstore logo
Download on app store

Categories

  • Basic Finance
  • Derivatives
  • Financial Planning
  • Fundamental Analysis
  • Technical Analysis
  • Marketshala
  • Miscellaneous

Popular On Elearnmarkets

  • Market Superheroes:
  • Vivek Bajaj
  • Chetan Panchamia
  • Ashish Kyal
  • Premal Parekh
  • Abhijit Paul
  • Jegan
  • Sivakumar Jayachadran
  • Vishal Malkan
  • Jyoti Budhia
  • Vivek Gadodia
  • Vishal Mehta
  • Piyush Chaudhry
  • Santosh Pasi
  • Gomathi Shankar
  • Market Superheroes:
  • Vivek Bajaj
  • Chetan Panchamia
  • Ashish Kyal
  • Premal Parekh
  • Abhijit Paul
  • Jegan
  • Sivakumar Jayachadran
  • Vishal Malkan
  • Jyoti Budhia
  • Vivek Gadodia
  • Vishal Mehta
  • Piyush Chaudhry
  • Santosh Pasi
  • Gomathi Shankar
  • Courses:​
  • Options Trading
  • Dow Theory
  • Momentum Trading
  • Stock Investing
  • Stock Market for Beginners
  • Harmonic Chart Patterns
  • Algo Trading
  • Elliot Wave Theory
  • Advanced Excel
  • Cryptocurrency
  • NSE Certification Course
  • Courses:​
  • Options Trading
  • Dow Theory
  • Momentum Trading
  • Stock Investing
  • Stock Market for Beginners
  • Harmonic Chart Patterns
  • Algo Trading
  • Elliot Wave Theory
  • Advanced Excel
  • Cryptocurrency
  • NSE Certification Course
  • Webinars:
  • Bank Nifty Scalping
  • Intraday Trading Strategies
  • Options Trading Strategies
  • Options selling
  • Price Action
  • Relative Strength
  • Tax Planning
  • Options Buying
  • Growth Stocks
  • Portfolio Management
  • Relative Strength Index
  • Risk Management
  • Renko Charts
  • Crude Oil
  • Traders Psychology
  • Moving Average
  • Multibagger Stocks
  • Free Learning Modules:
  • Intraday Trading
  • Options Scalping
  • Swing Trading
  • Financial Modelling
  • RSI Indicator
  • Bollinger Bands
  • Pricing of Futures
  • Personal Finance
  • Initial Public Offerings (IPO)
  • Value Investing
  • Technical Indicators
  • Candlesticks
  • Chart Patterns
  • Option Greeks
  • ELSS Funds
  • Banking and Insurance
  • Real Estate
  • Gold
  • Book Summaries:
  • Rich Dad Poor Dad
  • Psychology of Money
  • The Intelligent Investor
  • The Richest Man in Babylon
  • Think and Trade Like a Champion
  • Value Investing and Behavioural Finance
  • Trading in the Zone
  • Learn to Earn
  • Book Summaries:
  • Rich Dad Poor Dad
  • Psychology of Money
  • The Intelligent Investor
  • The Richest Man in Babylon
  • Think and Trade Like a Champion
  • Value Investing and Behavioural Finance
  • Trading in the Zone
  • Learn to Earn
  • Tools:
  • CAGR Calculator
  • SIP Calculator
  • eLearnOptions
  • Future Value Calculator
  • Present Value Calculator
  • Atal Pension Yojana
  • Cost of Delay Calculator
  • Become a Crorepati
  • Tools:
  • CAGR Calculator
  • SIP Calculator
  • eLearnOptions
  • Future Value Calculator
  • Present Value Calculator
  • Atal Pension Yojana
  • Cost of Delay Calculator
  • Become a Crorepati

© 2023 Elearnmarkets. All Rights Reserved

  • Visit Elearnmarkets
  • Courses
  • Webinars
  • Financial Guides
  • Get Free Counselling
  • Visit Elearnmarkets
  • Courses
  • Webinars
  • Financial Guides
  • Get Free Counselling

Get Elearnmarkets App

No Result
View All Result
  • Article Categories
    • Basic Finance
    • Derivatives
    • Financial Planning
    • Fundamental Analysis
    • Technical Analysis
    • Marketshala
    • Miscellaneous
  • Language
    • Hindi
    • Bengali
    • English
  • Courses
  • Webinars
  • Stories

© 2020 Elearnmarkets All Rights Reserved

A Handbook of Technical Analysis
To start your trading journey as a seasoned technical analyst
Download Now
View Course Details