Bank Nifty opened below its 5 Day Low EMA (24180 approx) today the 5th of September. The Index traded in a range of 176 points throughout the day and closed around the 8 DMA of (24300 approx).
Hourly Technicals:
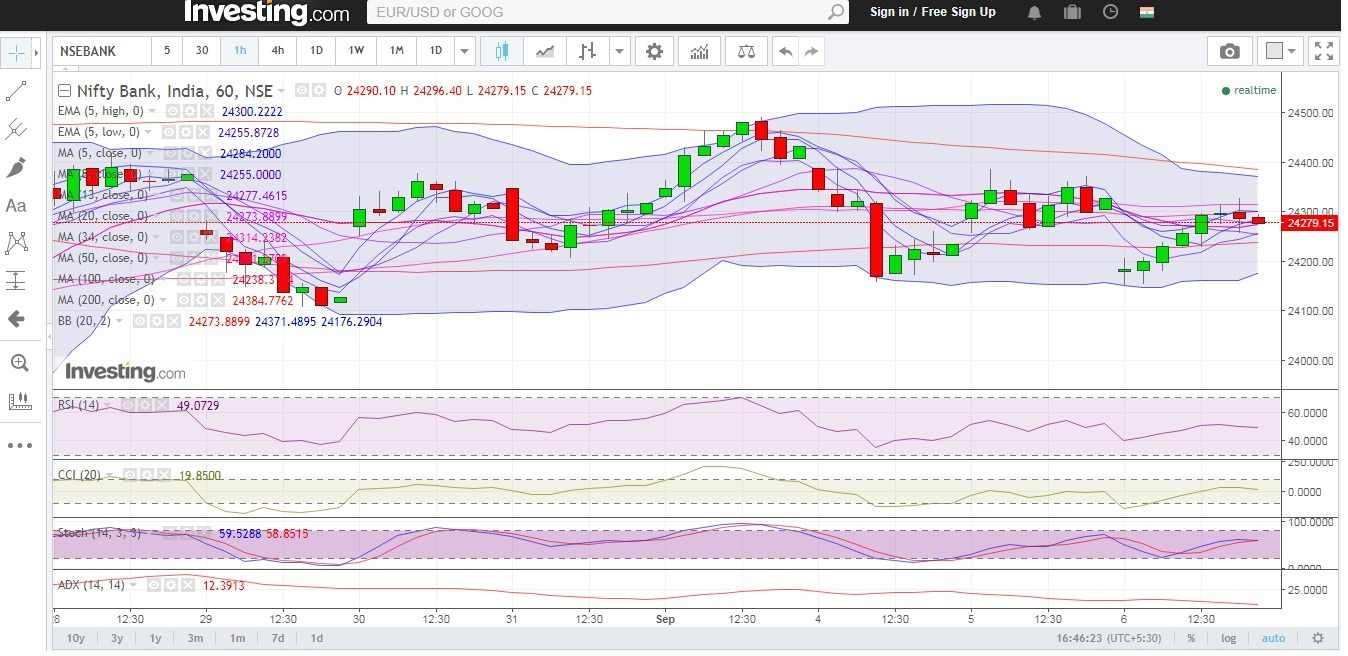
In the Hourly Chart, Bank Nifty has closed above its 5 Hour low EMA of (24255 approx).The Index is likely to face immediate resistance above the 5 hour high EMA (24329 approx) mark. Bank Nifty has to close convincingly above 24387 for the markets to be clearly in the buy zone.
Hourly RSI and CCI stands around the normal range while the ADX is indicating that Bank-Nifty will not undergo major volatility.

Figure: Bank-Nifty Hourly Chart
Daily Technicals:
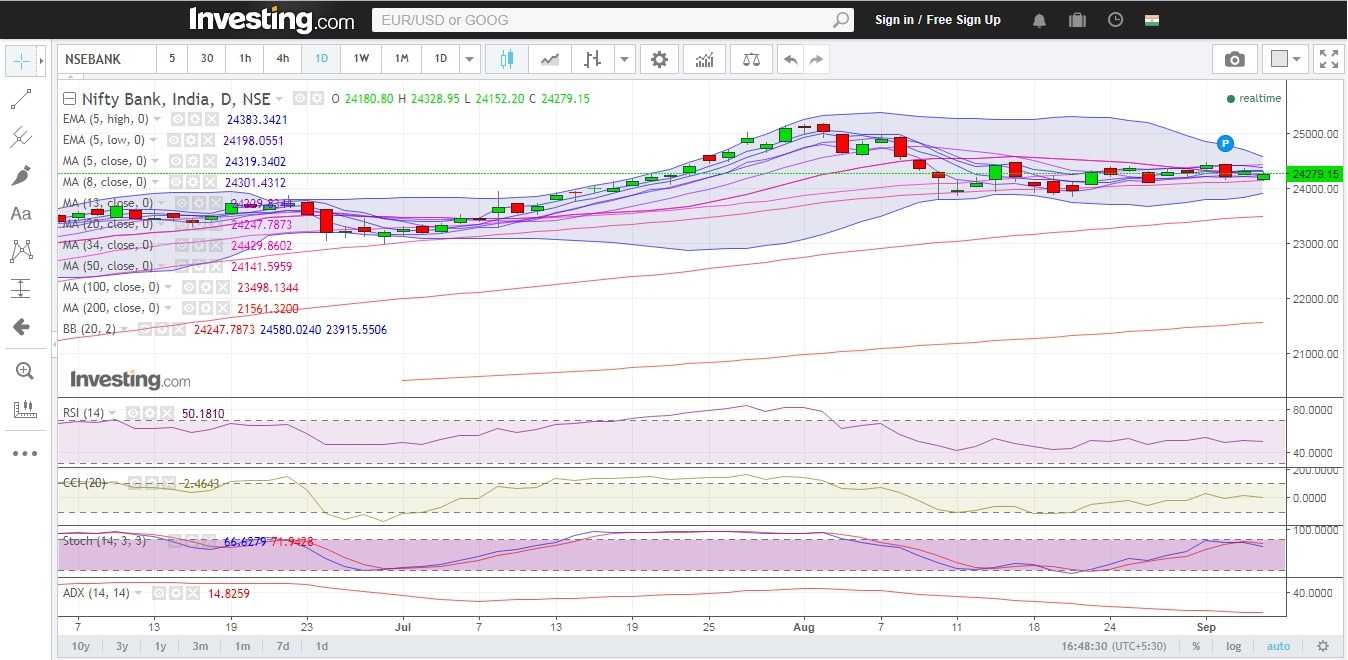
The daily chart indicates that Bank Nifty has closed marginally below the 8 DMA of (24301 approx). If the Index breaks above the 24532 mark, the next resistance will be 25000. On the downside however, if Bank-Nifty breaks and closes below its 50 Day MA (24100 approx), it could find support at the lower end of the Bollinger Band (23900 approx).
The daily RSI and CCI indicators have closed at their normal range. The ADX indicates lack of momentum.

Figure: Bank-Nifty Daily Chart

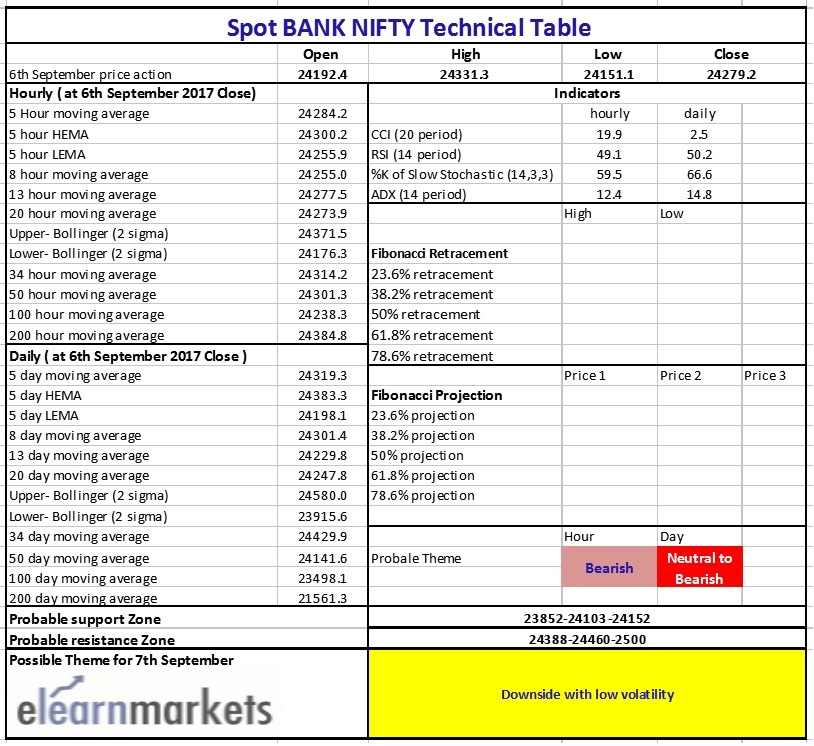
Figure: Bank-Nifty Tech table


