Bank Nifty opened above its 5 Day low EMA (25821 approx) today . The Index traded in a range of 123 points and closed below its opening price.
Hourly Technicals:
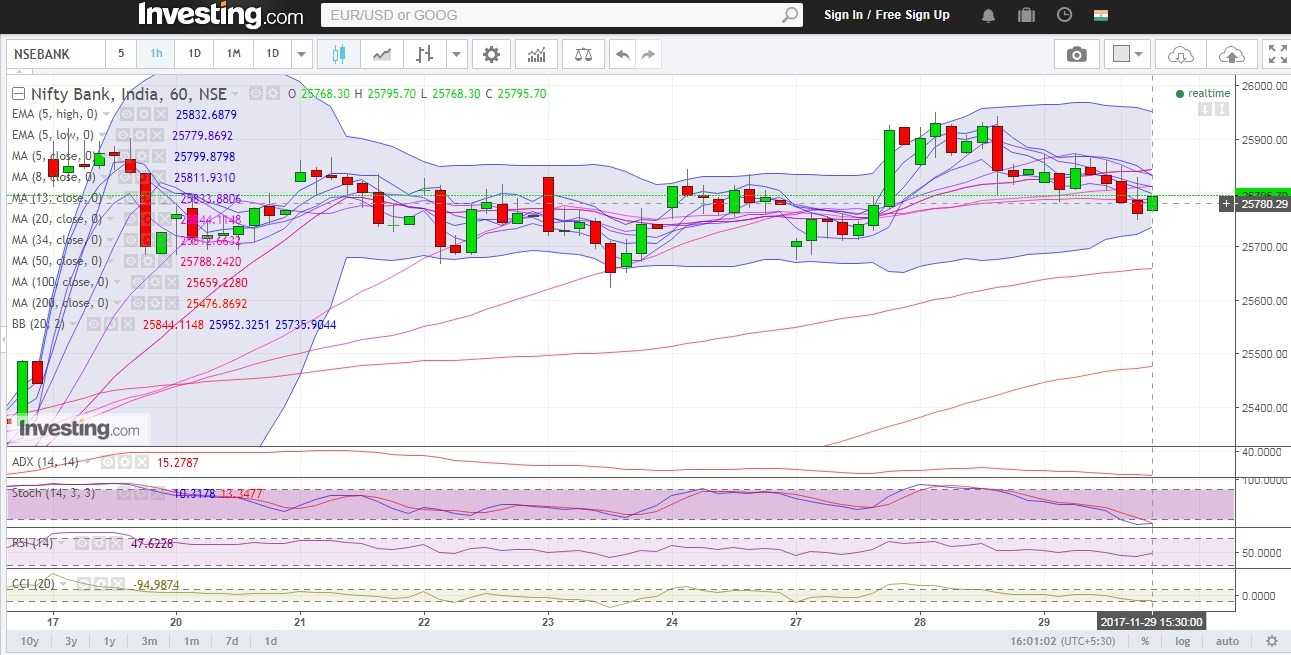
In the Hourly Chart, Bank Nifty has closed above its 5 hourly low EMA of (25780 approx).The Index is likely to face immediate resistance around its 5 hourly high EMA (25833 approx). If Bank Nifty breaks and closes below its hourly low (25768 approx) below which, the next support will be at its 100 HMA (25659 approx)
Hourly RSI stands midway between the normal range while the CCI is indicating that sentiments are negative. ADX is indicating that Bank Nifty might not undergo volatility.

Figure: Bank Nifty Hourly Chart
Daily Technicals:
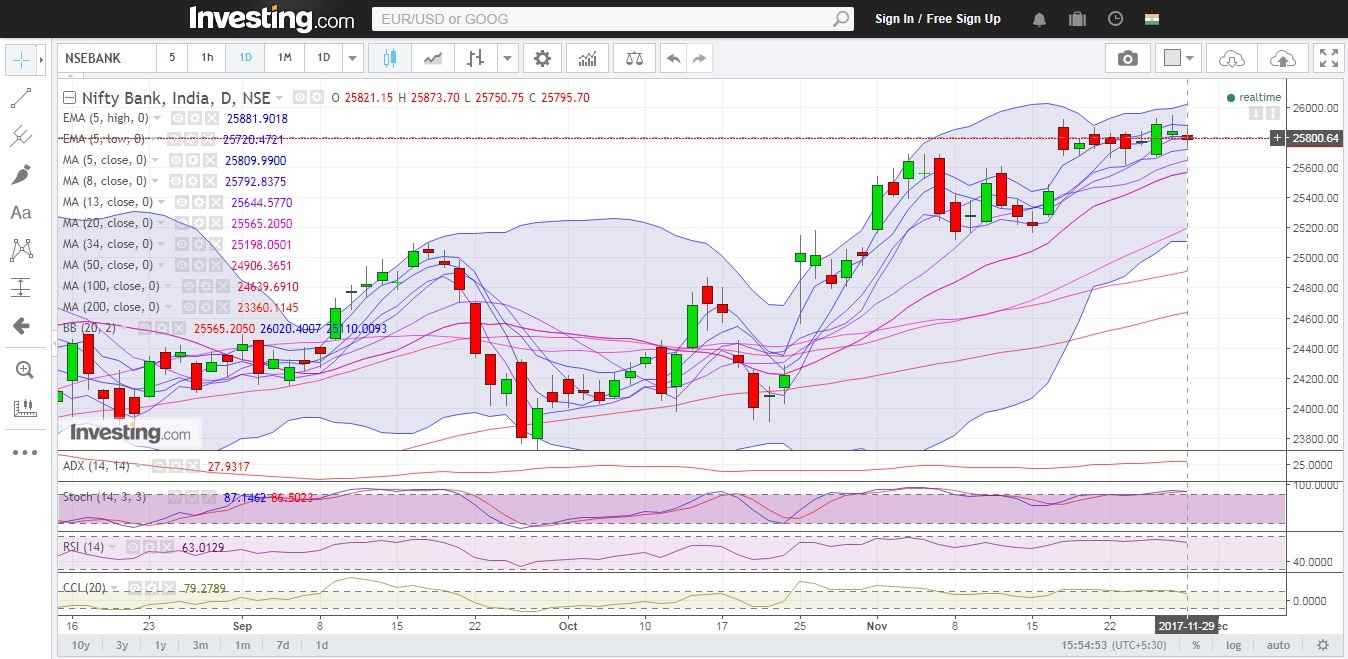
The daily chart indicates that Bank Nifty has closed at its 8 DMA (25795 approx). The Index will face immediate resistance around the 5 Day High EMA (25881 approx). On the downside however, if Bank Nifty breaks and closes below its 8 DMA (25792 approx), it could find support at its 13 DMA (25645 approx).
The daily RSI indicator has closed near the higher end of the normal range.The CCI indicator however is indicating that sentiments are positive.The ADX indicates that momentum might remain slack.

Figure: Bank Nifty Daily Chart

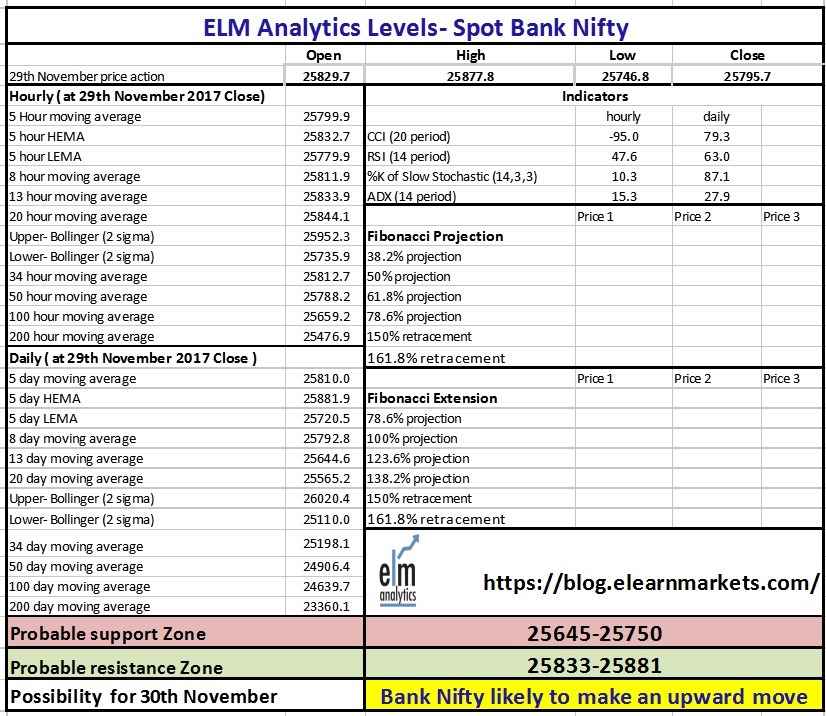
Figure: Bank Nifty Tech Table

BOTTOMLINE
You can use Stockedge app or website to get cutting edge over others in both short-term trading and investing. Here, you not only data at one particular place but an also create your own combination scans based on your technical and fundamental parameter.
Visit our platform Elearnmarkets and get access to various free and premium courses and also get to attend webinars hosted by market experts.


