Options trading may seem challenging at first, but the right technical indicators can simplify options trading for beginners. These tools help you spot trends, assess market volatility, and find the best entry and exit points for your trades.
By understanding how the best indicators for options trading work, you can make smarter, more informed trades instead of relying on guesswork. Let’s explore how these key indicators can help you make profitable moves in the market!
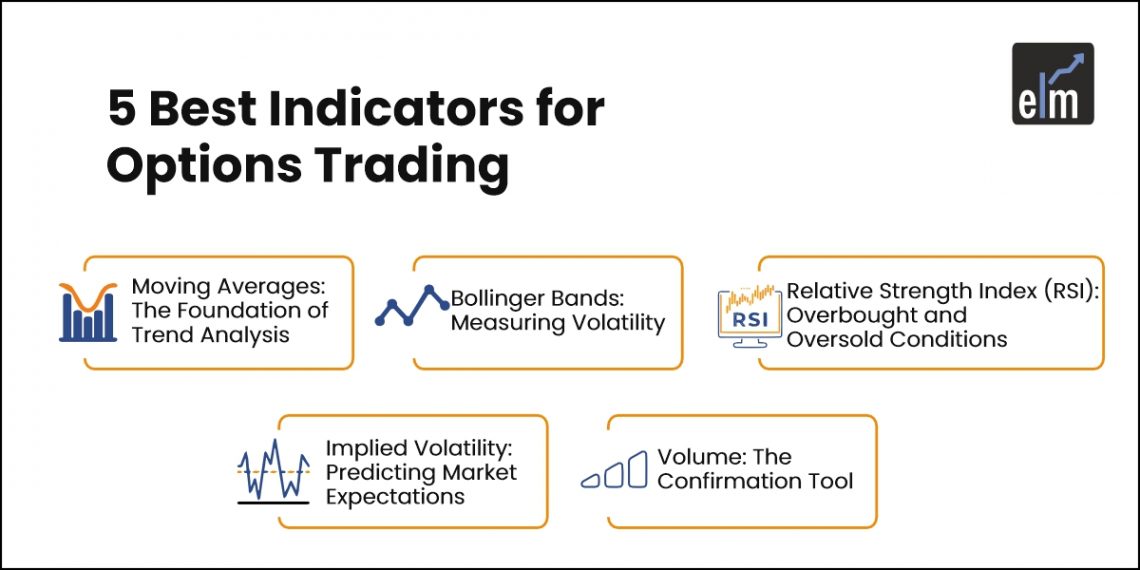
Moving Averages: The Foundation of Trend Analysis
Moving averages are one of the key tools in technical analysis, helping traders identify the direction of a stock’s trend by calculating averages from historical data. It is also known as a lagging indicator, as it follows historical price movements to signal future trends.
Options traders can use the moving averages indicator to predict the potential price direction of an underlying stock. Essentially, there are two main types of moving averages:
Simple Moving Average (SMA)
As the name suggests, Simple Moving Average (SMA) is the traditional moving average indicator that analyses data points in a set time period – say, a 7-day or 3-month period – to show the potential trend.
Traders use the SMA not just to gauge buy or sell signals, but also to identify key support and resistance levels. For instance, if a stock is consistently holding above its 50-day SMA, it could signal an uptrend, making it a good time to enter the trade.
Exponential Moving Average (EMA)
Now, imagine you’re more interested in your most recent price changes than those from weeks ago—this is where the Exponential Moving Average (EMA) comes in. It gives more importance to the latest price data, which makes it more responsive to recent market moves compared to the SMA.
For example, if a stock suddenly spikes, the EMA will show this change faster, helping traders react quickly. The key difference? EMA is more sensitive to current price changes, while SMA smooths everything out evenly over time.
Bollinger Bands: Measuring Volatility
Using Bollinger Bands is one of the best options trading strategies to measure market volatility. When the bands are narrow, it signals low volatility in the market, and when they widen, it suggests higher volatility.
How Bollinger Bands Work
Bollinger Bands consist of three lines:
- the middle band (a simple moving average of the asset’s price over a given period of time)
- the upper band (SMA plus a specified number of standard deviations)
- the lower band (SMA minus the same number of standard deviations)
If the price of the asset hits or crosses the upper band, it may be an indication that the asset might be overbought, signalling a potential sell. On the other hand, touching or crossing the lower band signals the asset may be oversold, indicating a possible buy.
Relative Strength Index (RSI): Overbought and Oversold Conditions
The relative strength index (RSI) is a momentum indicator that measures recent price changes as it moves between 0 and 100. It helps traders spot whether a stock is overbought or oversold, signalling potential trend reversals.
How to Use RSI in Options Trading
Imagine you’re following a stock and notice its RSI creeping above 70—this usually means it’s overbought, like a balloon ready to pop, signalling a possible trend reversal. On the flip side, if the RSI dips below 30, the stock might be oversold, signalling an upcoming upward shift.
For example, let’s say a stock’s RSI hits 80. You might take this as a cue to prepare a sell order, expecting the trend to reverse soon. On the other hand, if it hits 20, it could be your signal to buy, anticipating a bounce-back. By timing these signals, options traders can catch trend reversals and potentially lock in substantial profits.
Implied Volatility: Predicting Market Expectations
Implied volatility is the overall market’s expectations of a stock’s future price movements. It is different from realised volatility, which looks at a stock’s past price fluctuations. Think of it as a forecast giving traders an idea of how much a stock’s price could swing by its expiration date, over one standard deviation.
Why Implied Volatility Matters for Options Traders
Implied volatility is one of the best indicators for options trading for two reasons – one, it shows how volatile the market might be in the future. Second, implied volatility can help you calculate probability. This is a critical component of options trading that can help you assess the chances of a stock hitting a target price within a set timeframe.
Volume: The Confirmation Tool
Using a volume indicator is one of the best options trading strategies to understand the liquidity and market activity related to a stock. In simple words, volume indicators reflect the number of shares that are being traded at a given point, helping traders confirm or refute trading trends.
Using Volume in Options Trading
Volume indicators, like on-balance volume (OBV) and Accumulation/Distribution, measure the number of shares traded in a stock or contracts traded in futures or options.
Rising prices on increasing volume? That’s a sign of a strong, healthy market.
But if prices start falling with increasing volume, it’s like a snowball gaining speed downhill, signalling a stronger downtrend. On the flip side, if a stock hits new highs (or lows) with low volume, it’s a warning flag.
For example, if an option trader notices a stock climbing to a new high but fewer people are trading, it could hint at an upcoming reversal, like the calm before the storm. Stay alert—change might be on the way!
Tips to Simplify Trading with Options Trading Indicators
Whether you’re using Moving Averages, RSI, Bollinger Bands, or Implied Volatility, each indicator has its own role in shaping the right options trading strategy. Here are some quick tips to simplify your trading:
- Start with identifying trends: Use moving averages to spot overall trends and avoid getting overwhelmed by daily fluctuations in the market.
- Measure the momentum: Use momentum indicators to measure the speed and strength of price movements. Overbought conditions may signal a bearish move, while oversold levels hint at bullish opportunities.
- Assess the volatility: Volatility is a key factor in options pricing; this indicator helps you assess whether an option is priced fairly. High volatility signals bigger price swings, so adjust your strategy accordingly.
- Find your entry and exit points: Spot potential turning points of trends in relation to an underlying stock. By assessing whether it is in the overbought or oversold territory, you can fine-tune your entry and exit strategies.
Lastly, always seek confirmation from multiple indicators to boost the chances of a successful trade and avoid false signals. If two or more indicators align with each other and point towards the same outcome, it increases the probability of a successful trade.
As you explore the best indicators for options trading, it is essential to learn how to use them effectively. At Elearnmarkets, you can learn options trading for beginners from derivative market experts who will equip you with an understanding of the different tools and techniques related to options trading.
Frequently Asked Questions
Which option trading strategy is best for beginners?
The best option trading strategy for you depends on your outlook on the price of an underlying asset – if you have a bullish outlook, go with a long call strategy; if you are bearish, go for a long put strategy.
The long call is a straightforward options strategy where you buy a call option if you believe that the price of the underlying stock will rise above the strike price by expiration.
The long put strategy is simply the opposite of this, where you are buying a put option, betting that teh stock will fall below the strike price by expiration.
Which indicator is best for option trading?
The Relative Strength Index (RSI) is considered to be the best indicator for option trading – it is a momentum oscillator that measures the speed and change of price movements of an underlying stock.
Basically, RSI indicates whether a stock is overbought or oversold, helping traders identify the right entry and exit points.
How technical analysis works in option trading?
Technical analysis of a stock focuses on its price – it evaluates past trading activity and helps to identify potential price trends. By using a set of technical indicators (oscillators, moving averages, volume patterns, etc.) simultaneously, you can assess the future price movements of a stock and place trade orders accordingly.
Do these indicators work in all market conditions?
No, technical indicators are not error-proof at all times; they usually work well when there’s lots of historical data to analyse, or the price trends are long enough for an in-depth analysis.
Additionally, there is no guarantee that trends and patterns will repeat in the future, especially if there are any large-scale events that can alter the market conditions drastically (war, national emergency, etc.). It is always ideal to use such indicators with all forms of analysis.
Can I combine multiple indicators for better options trading results?
Yes, you can use different types of indicators together to get a more comprehensive overview of the market. There are several types of indicators available that interpret trends, momentum, volatility, volume, and more. Using a combination of them will help you identify your entry/exit points and confirm your strategies at the same time.
How can I learn more about these indicators and use them effectively?
To understand more about the best indicators for options trading, it’s essential to understand both the basics and the advanced applications of these tools. Elearnmarkets offers a variety of courses taught by expert instructors that can help you grasp the fundamentals and advanced strategies of technical analysis. You can learn options trading for beginners at your own pace, and use the indicators effectively while trading.


