Elearnmarkets - Financial Market Learning
  • Categories
    • Basic Finance
    • Derivatives
      • Futures
      • Options
    • Financial Planning
    • Fundamental Analysis
    • Technical Analysis
    • Marketshala
    • Miscellaneous
  • Language
    • English
    • Hindi
    • Bengali
No Result
View All Result
  • Courses
  • Webinars
  • Stories
Elearnmarkets - Learn Stock Market, trading, investing for Free
No Result
View All Result
Home Technical Analysis Market Analysis
Nifty hourly chart

Profit Booking Sets In Nifty After It Hits 10000, Nifty Finishes Flat

Elearnmarkets by Elearnmarkets
September 7, 2023
in Market Analysis, Market Updates
Reading Time: 3 mins read
0
52
VIEWS
Share on FacebookShare on XShare on WhatsApp

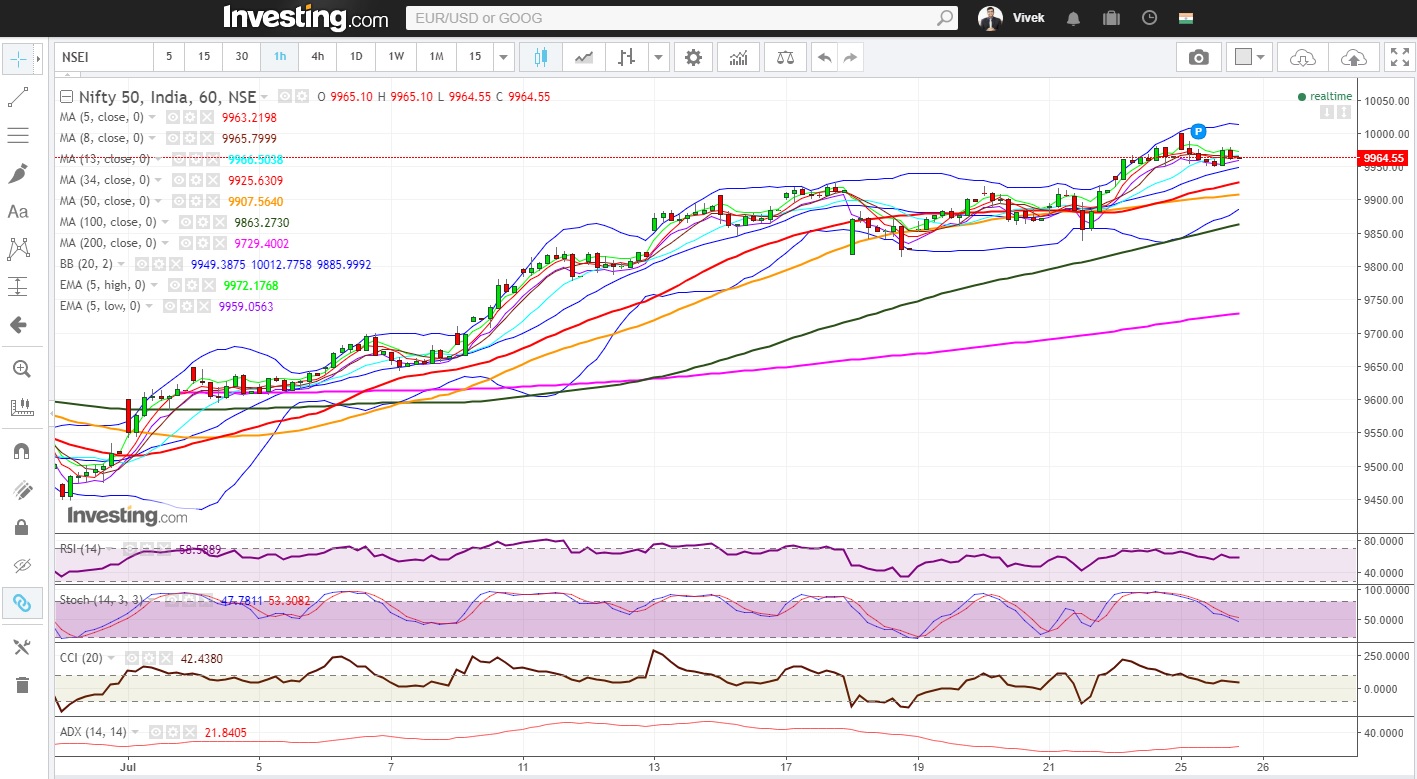
Nifty (approx close 9964.55 ): Nifty achieved the psychological 10000 mark in today’s trading and market drifted down due to profit booking during the day. Again Nifty closed near 5 hour moving average which is presently at 9963.2.

Hourly technical: The Nifty closed near 5, 8, 13 hourly moving averages which are all situated near 9965 region. On the downside, Nifty may get supported at 20 hour, 34 hour and 50 hour moving averages which are situated 9949, 9926 and 9908 approx on the downside.

On the upside, upper Bollinger band, which is presently at approx. 10013 should be a significant resistance for tomorrow.

The hourly RSI, CCI and Slow stochastic have entered into normal zone from overbought zone.
The tone of the market in hourly timeframe is neutral to bullish. A move above , 5 hour high ema (presently at 9972) should take Nifty to 10000-10013 level again, while a move below 50 hour moving average (presently at approx. 9907) will have bearish implications in hourly timeframe.

Nifty 50 hourly technical analysis using different Moving Averages and technical indicators RSI, CCI and ADX.

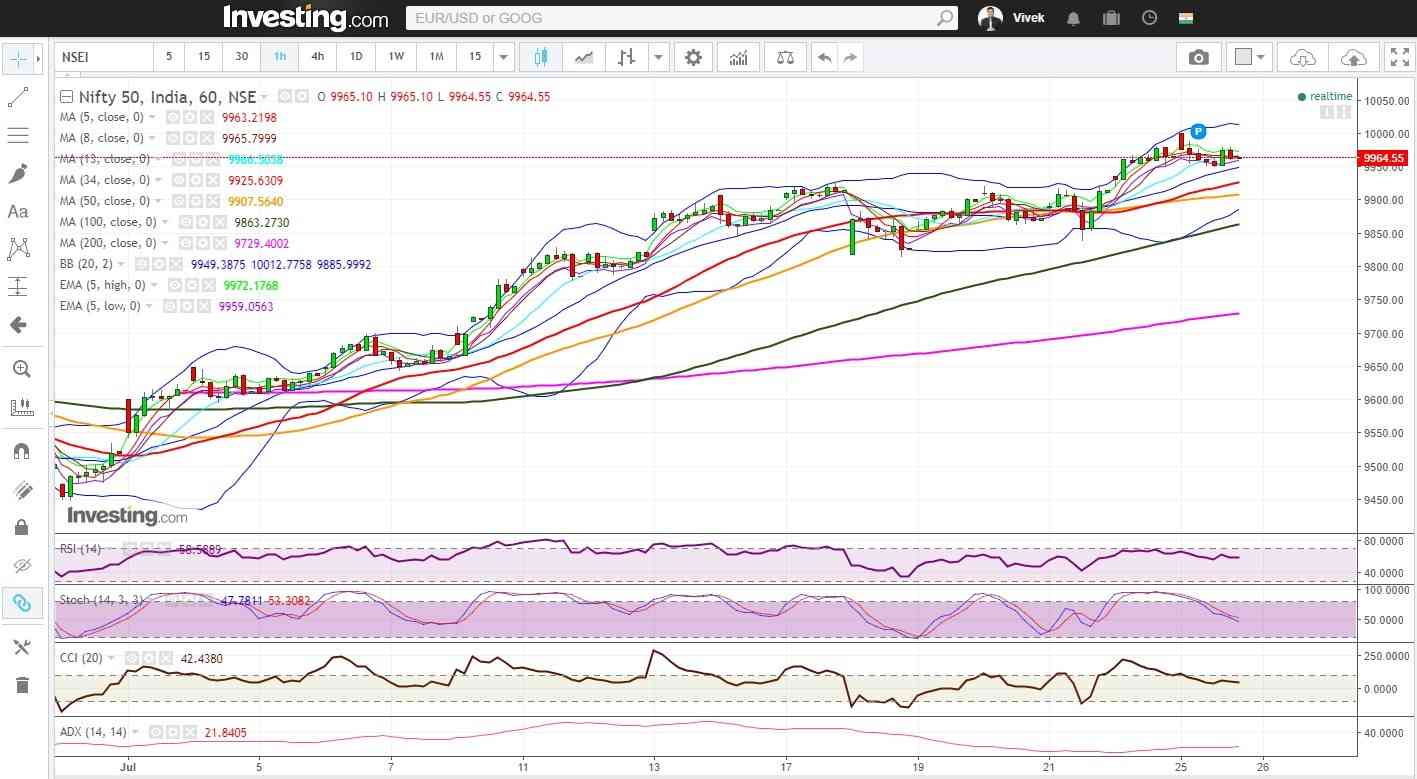
Figure: Hourly chart

Daily technical: In daily time frame, Nifty remains bullish. The Nifty closed above 5 day high ema which is presently situated at approx. 9955. Multiple short term daily moving averages are situated between the present price and 9893. If Nifty breaches even 9893 on the downside in tomorrow’s trading, it may try to find support near 13 DMA which is presently at approx. 9860.

On the upside the 100% projection of the last major up move from approx. 6826 to approx. 8969 from December 2016 low of approx 7893 comes at approx 10036. Hence, it should act as a significant resistance level in the near term.

RelatedPosts

Weekly Chart

Huge Sell-Off Makes the Market Close in a Negative Note on the Expiry Week

August 22, 2023
191
Hourly Chart

Nifty Ends in Green. Rupee Appreciates and Falling Crude Price Helped the Market to Recover Approx. 140 Point

August 31, 2023
133
Hourly Chart

Sell Off Continues. Nifty Ends The Week With Three Consecutive Red Candles

September 4, 2023
147

Also, we can see that the trend line resistance is situated near the 10040 zone.

The daily slow stochastic, CCI and RSI are all in bullish overbought zone. Overall, the scenario is neutral to bullish in daily time-frame.
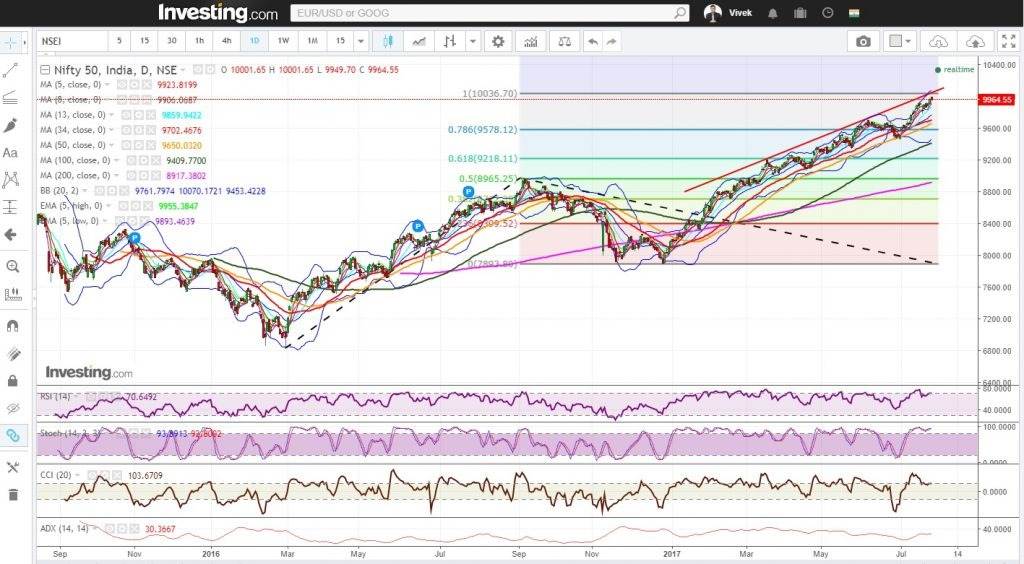
Nifty 50 daily chart showing trend line resistance is situated near the 10040 zone

Figure: Daily chart

Nifty option open interest analysis:

Two days are left for expiry. Nifty 10000 July series call saw 9 lakh shares added in open interest. Present open interest stands at approx. 74 lakh. The call price is 22.85. If Nifty moves up it should face good resistance in 10020-10030 zone. However, if Nifty moves past 10050, massive short covering may push the contract even higher. 9900 put saw almost 4 lakh shares added to open interest. The present open interest stands at approx. 64 lakhs. The premium of the 9900 put was down sharply. On the downside, a move below 9890 will see unwinding of 9900 puts. The 9800 put saw 9 lakh shares getting unwound.

Nifty open interest analysis

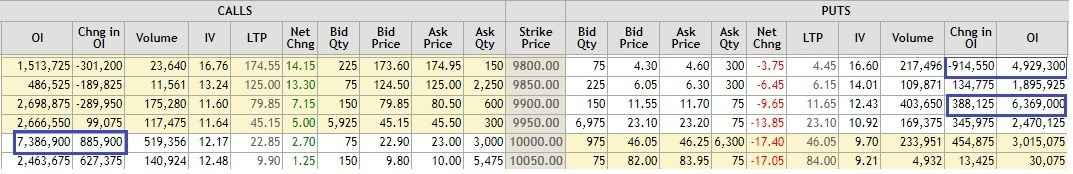
Figure: Open interest analysis

Profit Booking Sets In Nifty After It Hits 10000, Nifty Finishes Flat 1

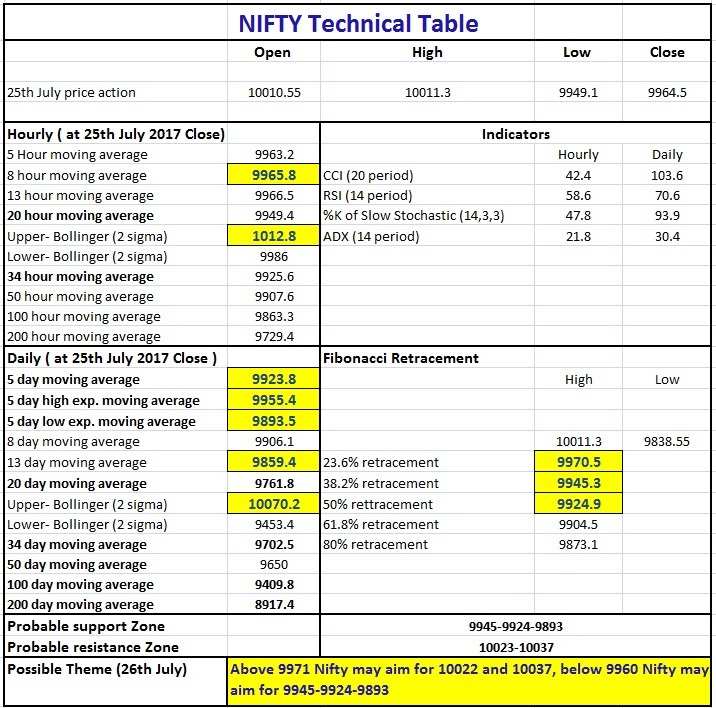
 Figure: Technical Table

Tags: english
ShareTweetSend
Get Kotak Offer Get Kotak Offer Get Kotak Offer
Previous Post

Nifty Aims For 10000 Mark , Closes Above Resistance Zone Of 9930

Next Post

ROC Indicator – How to trade with Rate of change Indicator ?

Elearnmarkets

Elearnmarkets

Elearnmarkets (ELM) is a complete financial market portal where the market experts have taken the onus to spread financial education. ELM constantly experiments with new education methodologies and technologies to make financial education effective, affordable and accessible to all. You can connect with us on Twitter @elearnmarkets.

Related Posts

Weekly Chart
Market Analysis

Huge Sell-Off Makes the Market Close in a Negative Note on the Expiry Week

August 22, 2023
191
Hourly Chart
Market Analysis

Nifty Ends in Green. Rupee Appreciates and Falling Crude Price Helped the Market to Recover Approx. 140 Point

August 31, 2023
133
Hourly Chart
Market Analysis

Sell Off Continues. Nifty Ends The Week With Three Consecutive Red Candles

September 4, 2023
147
Nifty Hourly Chart
Market Analysis

Nifty Witnessed A Flash Crash But Managed To Close Above 11100 Level

August 17, 2023
349

Leave a Reply Cancel reply

Your email address will not be published. Required fields are marked *

Elearnmarkets Logo

Follow Us

Facebook-f Twitter Instagram Linkedin-in Youtube Telegram

Register on Elearnmarkets

Continue your financial learning by creating your own account on Elearnmarkets.com

Register Free Account

Download App

Playstore logo
Download on app store

Categories

  • Basic Finance
  • Derivatives
  • Financial Planning
  • Fundamental Analysis
  • Technical Analysis
  • Marketshala
  • Miscellaneous

Popular On Elearnmarkets

  • Market Superheroes:
  • Vivek Bajaj
  • Chetan Panchamia
  • Ashish Kyal
  • Premal Parekh
  • Abhijit Paul
  • Jegan
  • Sivakumar Jayachadran
  • Vishal Malkan
  • Jyoti Budhia
  • Vivek Gadodia
  • Vishal Mehta
  • Piyush Chaudhry
  • Santosh Pasi
  • Gomathi Shankar
  • Market Superheroes:
  • Vivek Bajaj
  • Chetan Panchamia
  • Ashish Kyal
  • Premal Parekh
  • Abhijit Paul
  • Jegan
  • Sivakumar Jayachadran
  • Vishal Malkan
  • Jyoti Budhia
  • Vivek Gadodia
  • Vishal Mehta
  • Piyush Chaudhry
  • Santosh Pasi
  • Gomathi Shankar
  • Courses:​
  • Options Trading
  • Dow Theory
  • Momentum Trading
  • Stock Investing
  • Stock Market for Beginners
  • Harmonic Chart Patterns
  • Algo Trading
  • Elliot Wave Theory
  • Advanced Excel
  • Cryptocurrency
  • NSE Certification Course
  • Courses:​
  • Options Trading
  • Dow Theory
  • Momentum Trading
  • Stock Investing
  • Stock Market for Beginners
  • Harmonic Chart Patterns
  • Algo Trading
  • Elliot Wave Theory
  • Advanced Excel
  • Cryptocurrency
  • NSE Certification Course
  • Webinars:
  • Bank Nifty Scalping
  • Intraday Trading Strategies
  • Options Trading Strategies
  • Options selling
  • Price Action
  • Relative Strength
  • Tax Planning
  • Options Buying
  • Growth Stocks
  • Portfolio Management
  • Relative Strength Index
  • Risk Management
  • Renko Charts
  • Crude Oil
  • Traders Psychology
  • Moving Average
  • Multibagger Stocks
  • Free Learning Modules:
  • Intraday Trading
  • Options Scalping
  • Swing Trading
  • Financial Modelling
  • RSI Indicator
  • Bollinger Bands
  • Pricing of Futures
  • Personal Finance
  • Initial Public Offerings (IPO)
  • Value Investing
  • Technical Indicators
  • Candlesticks
  • Chart Patterns
  • Option Greeks
  • ELSS Funds
  • Banking and Insurance
  • Real Estate
  • Gold
  • Book Summaries:
  • Rich Dad Poor Dad
  • Psychology of Money
  • The Intelligent Investor
  • The Richest Man in Babylon
  • Think and Trade Like a Champion
  • Value Investing and Behavioural Finance
  • Trading in the Zone
  • Learn to Earn
  • Book Summaries:
  • Rich Dad Poor Dad
  • Psychology of Money
  • The Intelligent Investor
  • The Richest Man in Babylon
  • Think and Trade Like a Champion
  • Value Investing and Behavioural Finance
  • Trading in the Zone
  • Learn to Earn
  • Tools:
  • CAGR Calculator
  • SIP Calculator
  • eLearnOptions
  • Future Value Calculator
  • Present Value Calculator
  • Atal Pension Yojana
  • Cost of Delay Calculator
  • Become a Crorepati
  • Tools:
  • CAGR Calculator
  • SIP Calculator
  • eLearnOptions
  • Future Value Calculator
  • Present Value Calculator
  • Atal Pension Yojana
  • Cost of Delay Calculator
  • Become a Crorepati

© 2023 Elearnmarkets. All Rights Reserved

  • Visit Elearnmarkets
  • Courses
  • Webinars
  • Financial Guides
  • Get Free Counselling
  • Visit Elearnmarkets
  • Courses
  • Webinars
  • Financial Guides
  • Get Free Counselling

Get Elearnmarkets App

No Result
View All Result
  • Article Categories
    • Basic Finance
    • Derivatives
    • Financial Planning
    • Fundamental Analysis
    • Technical Analysis
    • Marketshala
    • Miscellaneous
  • Language
    • Hindi
    • Bengali
    • English
  • Courses
  • Webinars
  • Stories

© 2020 Elearnmarkets All Rights Reserved