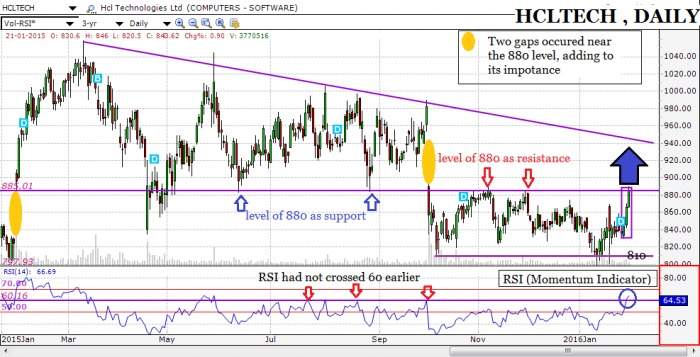
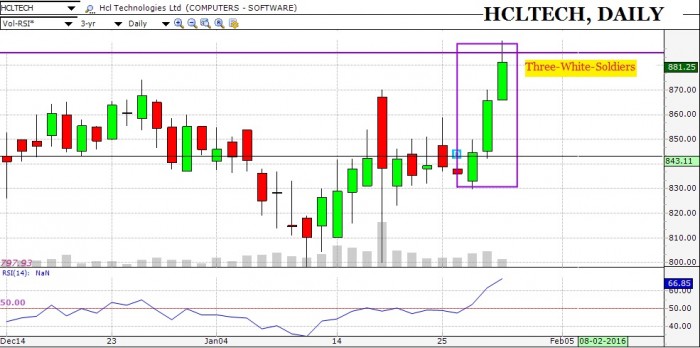
After consolidating for 4 months (Oct ’15-Jan ’16) in the range of 810-880, HCL TECHNOLOGIES (HCLTECH) has developed a Japanese Candle Stick Pattern called the Three White Soldiers.
Also Read: All you need to know about the Japanese Candlestick
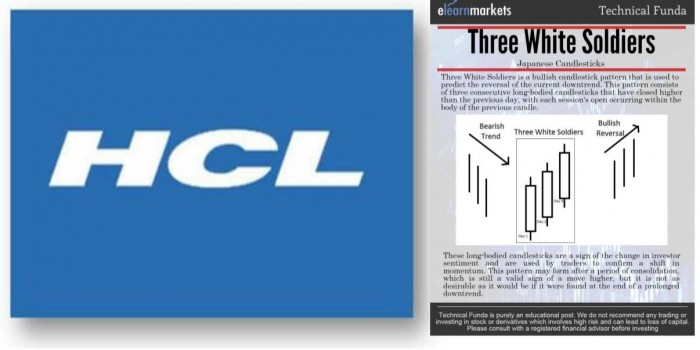
The Three White Soldiers is a bullish pattern which forms after a strong downtrend or a prolonged consolidation. The appearance of this pattern, suggests that participation in the stock is increasing in a sustained manner, leading to a rise in price.
Now, if we look at the chart below, and correspondingly study the momentum indicator: RSI (Relative Strength Index), we see that a very interesting phenomenon has surfaced.
Also Read: RSI Indicator and How is it useful in Trading Stocks?
Earlier, within the consolidation, we saw that the price was resisting at the level of 880 whereas RSI turned down from the 50 level. But, this time, though the price is still near the level of 880, RSI has already broken above the 50 level and crossed over the previous highs. Adding on to this, currently, RSI is marking the 64 level, which is the ‘bull trend’-range.

Therefore, from the combined study of the candlestick chart of HCLTECH and the momentum indicator RSI, we can conclude that there has been an evident shift in the sentiments and the level of 880 is the resistance which the stock needs to overcome to really prove the usefulness of the candlestick pattern – Three White Soldiers, and the RSI ‘Range Break’.
If you want to learn the art and science of trading with the help of extensive technical analysis of stocks, the analysis of financial charts, trading strategies and more: you can enrol for NSE Academy Certified Technical Analysis on Elearnmarkets.com


