Elearnmarkets - Financial Market Learning
  • Categories
    • Basic Finance
    • Derivatives
    • Financial Planning
    • Fundamental Analysis
    • Technical Analysis
    • Marketshala
    • Miscellaneous
  • Language
    • English
    • Hindi
    • Bengali
No Result
View All Result
  • Courses
  • Webinars
  • Learn On Elearnmarkets
Elearnmarkets - Learn Stock Market, trading, investing for Free
No Result
View All Result
Home Fundamental Analysis
Factors that drive Cyclical Industry 1

Factors that drive Cyclical Industry

Elearnmarkets by Elearnmarkets
July 18, 2022
in Fundamental Analysis, Sector Analysis
Reading Time: 6 mins read
1
3.2k
VIEWS
Share on FacebookShare on TwitterShare on WhatsApp

Listen to this:

Cyclical Industry is an industry that is sensitive to the business cycle of an economy.

The revenues from the industry are generally higher in periods of economic prosperity and expansion.

So a cyclical industry is highly correlated to the economic activity.

Few examples of cyclical industries are cement, construction, steel, capital goods, among others.

Table of Contents
Gross Domestic Product (GDP)
Consumer spending levels
Indicators
Aspects that drive the Cyclical stocks performance and price
Bottomline

Thus, from the above examples, it is clear that these sectors are directly linked to economic growth or tends to see an indirect income effect emanating from shifts in economic growth.

Cyclical sectors and their stocks surge when the economy is in an uptrend and these are exactly the types of sectors that should be avoided when the economy is weak.

Influences on Cyclical Industry

1.Gross Domestic Product (GDP)

Cyclical industries are directly impacted by the economy’s overall performance, which is measured by the GDP, a measurement of economic output.

The rise in GDP indicates that the economy is growing leading to higher employment rate and thus higher disposable income, leading people to increase their spending for various purposes.

It also indicates a rise in government spending on infrastructure and allied activities.

This leads to stocks of sectors like cement, steel, telecommunication, technology and capital goods produce higher returns.

Few of the companies in these segments are Larsen & Toubro, Tata Steel, Ambuja Cement, Bharti Airtel, Tata Consultancy Services, Havells, Bharat Electronics and others.

2. Consumer spending levels

This has a major influence on the cyclical industry and its stocks.

This can be gauged by tracking COI (Consumer Confidence Index) which provide insight on how much people are saving as compared to how much they are spending and the overall sentiment that is ruling the market.

In other words, it measures how optimistic or pessimistic consumers are about the economy’s current and future performance.

When the index is high, consumers are expected to increase their spending on goods and services. Thus, the stocks of cyclical industries surges.

When the index is low, a decrease in spending is expected. Thus, the stocks of cyclical industries head southwards.

That is why, stocks of companies like Maruti Suzuki India, Titan, Whirlpool, Indian Hotels usually sees a surge when the index performs well.

3. Indicators

As we know that the performance of the cyclical sector is directly related to the performance of the economy.

Growth in the economy results in robust performance of cyclical stocks.

Learn for Free: What are Technical Indicators

So, there are various indicators that help gauge the overall performance of the economy.

Few of which are as follows:

cyclical industry indicators
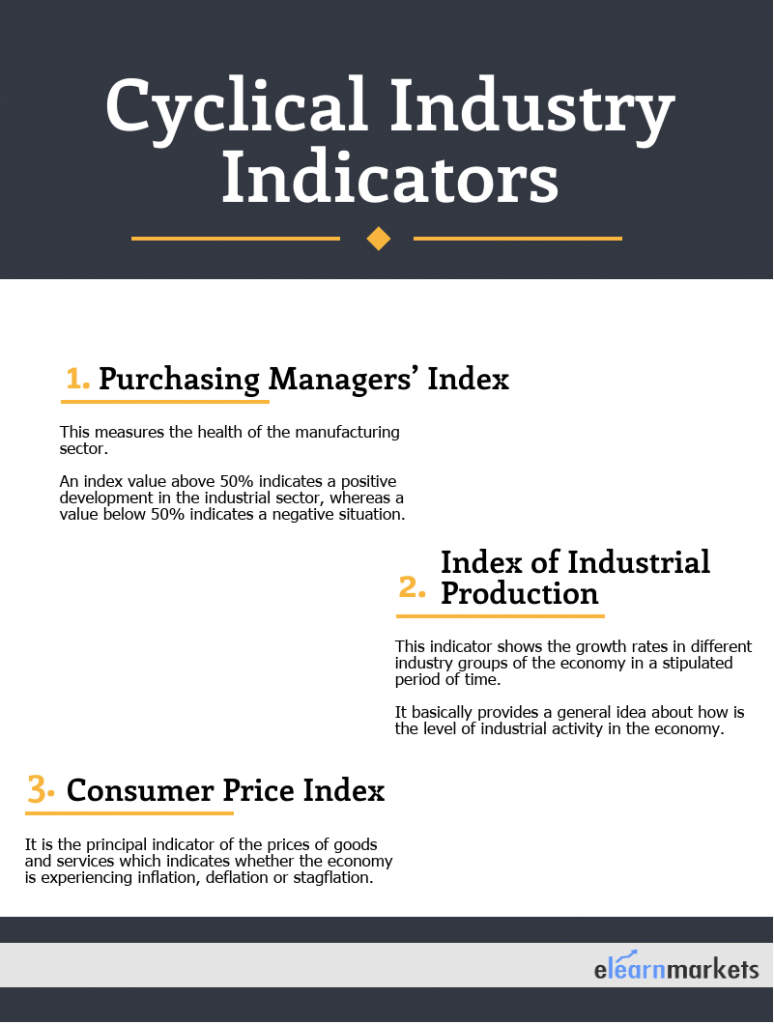
  • PMI (Purchasing Managers’ Index ): This measures the health of the manufacturing sector. An index value above 50% indicates a positive development in the industrial sector, whereas a value below 50% indicates a negative situation.
  • IIP (Index of Industrial Production)– This indicator shows the growth rates in different industry groups of the economy in a stipulated period of time. Index of Industrial Production basically provides a general idea about how is the level of industrial activity in the economy.
  • CPI (Consumer Price Index)– It is the principal indicator of the prices of goods and services which indicates whether the economy is experiencing inflation, deflation or stagflation.

Along with the above, other indicators affecting cyclical are Interest rates, rural growth and energy prices which can impact GDP growth.

When the indicators show positive sentiment means that the GDP of the economy is growing and in turn the cyclical stocks will produce strong returns.

Aspects that drive the Cyclical stocks performance and price:

  • The beta of the stock – The first is the Beta value or systemic risk. Cyclicals tend to have high beta values, which are usually higher than 1. A beta of 1.5 means if the market falls 10 %, the stock is likely to fall 15 per cent.
  • Earnings Per Share – Cyclical stocks tend to have volatile earnings per share or EPS, as their earnings keep on fluctuating in relation to the sentiment in the economy.
  • Price – Earnings Ratio – Cyclical generally tend to have low PE ratios, making them cheaper in comparison to defensive stocks.

Bottomline

The bottom line is that cyclical industry is largely dependent on economic growth. When the combination of investment and growth is in their favor, the stocks of the cyclical industry can give steady returns in a very short period. This makes the stocks of cyclical industry critical from portfolio point of view.

Tags: advancebetaenglishEPS
Share15TweetSend
Previous Post

Understand the Impact of Corporate actions on Financial ratios

Next Post

Market reacts with Union Budget corrects approx. 180 points

Elearnmarkets

Elearnmarkets

Elearnmarkets (ELM) is a complete financial market portal where the market experts have taken the onus to spread financial education. ELM constantly experiments with new education methodologies and technologies to make financial education effective, affordable and accessible to all. You can connect with us on Twitter @elearnmarkets.

Related Posts

3 Important Factors to Consider when picking the right Penny Stocks for Investing 2
Basic Finance

3 Important Factors to Consider when picking the right Penny Stocks for Investing

October 13, 2022
11.7k
9 Important Things to Consider in Quarterly Results Before Investing in Stocks 3
Fundamental Analysis

9 Important Things to Consider in Quarterly Results Before Investing in Stocks

October 25, 2022
6.6k
cash flow analysis
Fundamental Analysis

5 Ratios for Cash Flow Analysis

August 11, 2022
13.8k
turnover ratio
Fundamental Analysis

6 Turnover ratios for Checking the Company’s Efficiency in Generating Sales

August 11, 2022
8.7k

Comments 1

  1. Clmohanrao says:
    3 years ago

    Excellent data sir. Be safe sir.

    Reply

Leave a Reply Cancel reply

Your email address will not be published. Required fields are marked *

Follow Us

Facebook-f Twitter Instagram Linkedin-in Youtube Telegram

Register on Elearnmarkets

Continue your financial learning by creating your own account on Elearnmarkets.com

Register Free Account

Download App

Categories

  • Basic Finance
  • Derivatives
  • Financial Planning
  • Fundamental Analysis
  • Technical Analysis
  • Marketshala
  • Miscellaneous

Popular On Elearnmarkets

  • Market Superheroes:
  • Vivek Bajaj
  • Chetan Panchamia
  • Ashish Kyal
  • Premal Parekh
  • Abhijit Paul
  • Jegan
  • Sivakumar Jayachadran
  • Vishal Malkan
  • Jyoti Budhia
  • Vivek Gadodia
  • Vishal Mehta
  • Piyush Chaudhry
  • Santosh Pasi
  • Gomathi Shankar
  • Market Superheroes:
  • Vivek Bajaj
  • Chetan Panchamia
  • Ashish Kyal
  • Premal Parekh
  • Abhijit Paul
  • Jegan
  • Sivakumar Jayachadran
  • Vishal Malkan
  • Jyoti Budhia
  • Vivek Gadodia
  • Vishal Mehta
  • Piyush Chaudhry
  • Santosh Pasi
  • Gomathi Shankar
  • Courses:​
  • Options Trading
  • Dow Theory
  • Momentum Trading
  • Stock Investing
  • Stock Market for Beginners
  • Harmonic Chart Patterns
  • Algo Trading
  • Elliot Wave Theory
  • Advanced Excel
  • Cryptocurrency
  • NSE Certification Course
  • Courses:​
  • Options Trading
  • Dow Theory
  • Momentum Trading
  • Stock Investing
  • Stock Market for Beginners
  • Harmonic Chart Patterns
  • Algo Trading
  • Elliot Wave Theory
  • Advanced Excel
  • Cryptocurrency
  • NSE Certification Course
  • Webinars:
  • Bank Nifty Scalping
  • Intraday Trading Strategies
  • Options Trading Strategies
  • Options selling
  • Price Action
  • Relative Strength
  • Tax Planning
  • Options Buying
  • Growth Stocks
  • Portfolio Management
  • Relative Strength Index
  • Risk Management
  • Renko Charts
  • Crude Oil
  • Traders Psychology
  • Moving Average
  • Multibagger Stocks
  • Free Learning Modules:
  • Intraday Trading
  • Options Scalping
  • Swing Trading
  • Financial Modelling
  • RSI Indicator
  • Bollinger Bands
  • Pricing of Futures
  • Personal Finance
  • Initial Public Offerings (IPO)
  • Value Investing
  • Technical Indicators
  • Candlesticks
  • Chart Patterns
  • Option Greeks
  • ELSS Funds
  • Banking and Insurance
  • Real Estate
  • Gold
  • Book Summaries:
  • Rich Dad Poor Dad
  • Psychology of Money
  • The Intelligent Investor
  • The Richest Man in Babylon
  • Think and Trade Like a Champion
  • Value Investing and Behavioural Finance
  • Trading in the Zone
  • Learn to Earn
  • Book Summaries:
  • Rich Dad Poor Dad
  • Psychology of Money
  • The Intelligent Investor
  • The Richest Man in Babylon
  • Think and Trade Like a Champion
  • Value Investing and Behavioural Finance
  • Trading in the Zone
  • Learn to Earn
  • Tools:
  • CAGR Calculator
  • SIP Calculator
  • eLearnOptions
  • Future Value Calculator
  • Present Value Calculator
  • Atal Pension Yojana
  • Cost of Delay Calculator
  • Become a Crorepati
  • Tools:
  • CAGR Calculator
  • SIP Calculator
  • eLearnOptions
  • Future Value Calculator
  • Present Value Calculator
  • Atal Pension Yojana
  • Cost of Delay Calculator
  • Become a Crorepati

© 2023 Elearnmarkets. All Rights Reserved

  • Visit Elearnmarkets
  • Courses
  • Webinars
  • Financial Guides
  • Get Free Counselling
  • Visit Elearnmarkets
  • Courses
  • Webinars
  • Financial Guides
  • Get Free Counselling

Get Elearnmarkets App

No Result
View All Result
  • Article Categories
    • Basic Finance
    • Derivatives
    • Financial Planning
    • Fundamental Analysis
    • Technical Analysis
    • Marketshala
    • Miscellaneous
  • Language
    • Hindi
    • Bengali
    • English
  • Courses
  • Webinars

© 2020 Elearnmarkets All Rights Reserved